| Full name: phospholipase A1 member A | Alias Symbol: ps-PLA1 | ||
| Type: protein-coding gene | Cytoband: 3q13.33 | ||
| Entrez ID: 51365 | HGNC ID: HGNC:17661 | Ensembl Gene: ENSG00000144837 | OMIM ID: 607460 |
PLA1A involved pathways:
| KEGG pathway | Description | View |
|---|---|---|
| hsa04014 | Ras signaling pathway |
Expression of PLA1A:
| Dataset | Gene | EntrezID | Probe | Log2FC | Adj.pValue | Expression |
|---|---|---|---|---|---|---|
| GSE17351 | PLA1A | 51365 | 219584_at | 0.2056 | 0.8657 | |
| GSE20347 | PLA1A | 51365 | 219584_at | 0.1370 | 0.2201 | |
| GSE23400 | PLA1A | 51365 | 219584_at | -0.1175 | 0.0099 | |
| GSE26886 | PLA1A | 51365 | 219584_at | -0.0707 | 0.7697 | |
| GSE29001 | PLA1A | 51365 | 219584_at | 0.1916 | 0.3158 | |
| GSE38129 | PLA1A | 51365 | 219584_at | 0.0432 | 0.8540 | |
| GSE45670 | PLA1A | 51365 | 219584_at | -0.2573 | 0.4837 | |
| GSE53622 | PLA1A | 51365 | 94715 | -0.3261 | 0.0075 | |
| GSE53624 | PLA1A | 51365 | 94715 | -0.2860 | 0.0894 | |
| GSE63941 | PLA1A | 51365 | 219584_at | -0.3592 | 0.0417 | |
| GSE77861 | PLA1A | 51365 | 219584_at | 0.0809 | 0.5369 | |
| GSE97050 | PLA1A | 51365 | A_24_P294408 | 0.0596 | 0.7898 | |
| SRP133303 | PLA1A | 51365 | RNAseq | -0.8491 | 0.0118 | |
| SRP159526 | PLA1A | 51365 | RNAseq | 0.6272 | 0.4266 | |
| SRP219564 | PLA1A | 51365 | RNAseq | 0.1765 | 0.7957 | |
| TCGA | PLA1A | 51365 | RNAseq | -1.3165 | 0.0020 |
Upregulated datasets: 0; Downregulated datasets: 1.
Survival by PLA1A expression:
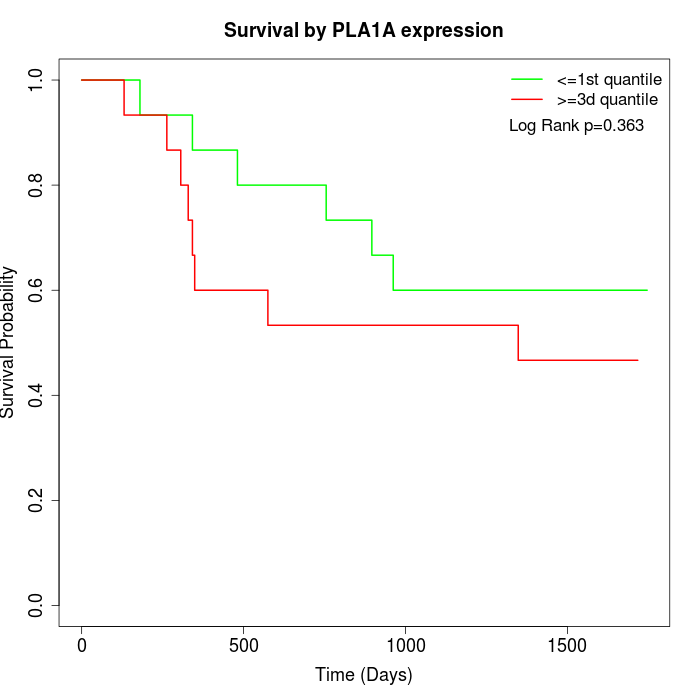 | 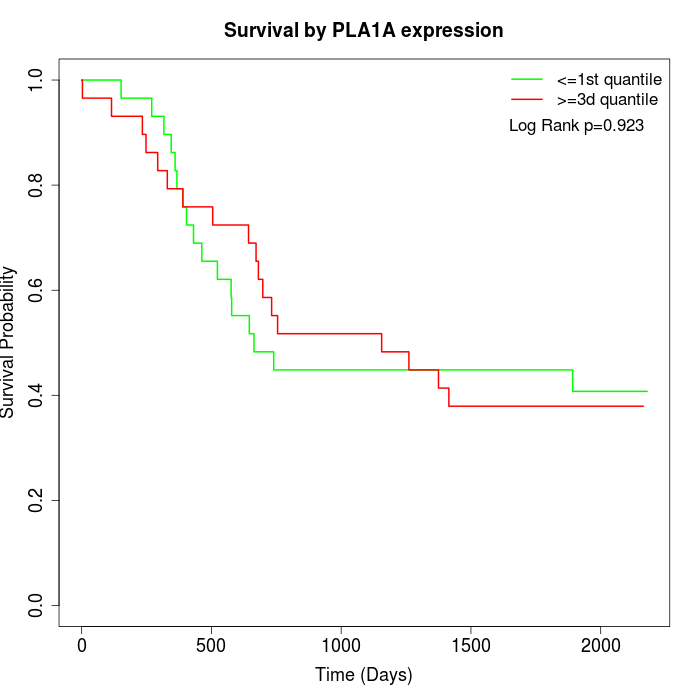 | 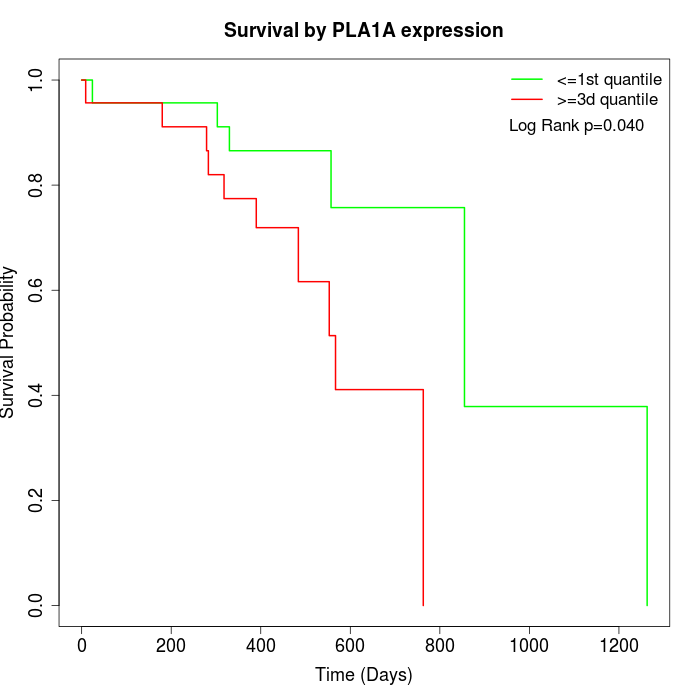 |
| GSE53622 | GSE53624 | TCGA |
Note: Click image to view full size file.
Copy number change of PLA1A:
| Dataset | Gene | EntrezID | Gain | Loss | Normal | Detail |
|---|---|---|---|---|---|---|
| GSE15526 | PLA1A | 51365 | 18 | 0 | 12 | |
| GSE20123 | PLA1A | 51365 | 18 | 0 | 12 | |
| GSE43470 | PLA1A | 51365 | 21 | 1 | 21 | |
| GSE46452 | PLA1A | 51365 | 14 | 5 | 40 | |
| GSE47630 | PLA1A | 51365 | 16 | 5 | 19 | |
| GSE54993 | PLA1A | 51365 | 2 | 6 | 62 | |
| GSE54994 | PLA1A | 51365 | 30 | 4 | 19 | |
| GSE60625 | PLA1A | 51365 | 0 | 6 | 5 | |
| GSE74703 | PLA1A | 51365 | 17 | 1 | 18 | |
| GSE74704 | PLA1A | 51365 | 13 | 0 | 7 | |
| TCGA | PLA1A | 51365 | 53 | 7 | 36 |
Total number of gains: 202; Total number of losses: 35; Total Number of normals: 251.
Somatic mutations of PLA1A:
Generating mutation plots.
Highly correlated genes for PLA1A:
Showing top 20/124 corelated genes with mean PCC>0.5.
| Gene1 | Gene2 | Mean PCC | Num. Datasets | Num. PCC<0 | Num. PCC>0.5 |
|---|---|---|---|---|---|
| PLA1A | DNAJA4 | 0.686279 | 4 | 0 | 4 |
| PLA1A | ECSCR | 0.685704 | 4 | 0 | 4 |
| PLA1A | RNF175 | 0.667666 | 3 | 0 | 3 |
| PLA1A | HAPLN3 | 0.646962 | 4 | 0 | 4 |
| PLA1A | PLCL2 | 0.617702 | 7 | 0 | 5 |
| PLA1A | ENPP2 | 0.604898 | 6 | 0 | 5 |
| PLA1A | AGT | 0.604363 | 6 | 0 | 4 |
| PLA1A | RAMP3 | 0.596968 | 9 | 0 | 8 |
| PLA1A | SMOC2 | 0.590548 | 4 | 0 | 3 |
| PLA1A | CCL19 | 0.590165 | 7 | 0 | 5 |
| PLA1A | SLC26A4 | 0.589751 | 6 | 0 | 5 |
| PLA1A | SIRPD | 0.587634 | 3 | 0 | 3 |
| PLA1A | CYTIP | 0.586484 | 5 | 0 | 4 |
| PLA1A | ETV7 | 0.585744 | 3 | 0 | 3 |
| PLA1A | HTN1 | 0.583893 | 3 | 0 | 3 |
| PLA1A | LGALS9 | 0.577943 | 4 | 0 | 3 |
| PLA1A | KDR | 0.577354 | 3 | 0 | 3 |
| PLA1A | SRGN | 0.576427 | 5 | 0 | 4 |
| PLA1A | SELL | 0.574043 | 6 | 0 | 5 |
| PLA1A | TRANK1 | 0.571614 | 4 | 0 | 3 |
For details and further investigation, click here