| Full name: plastin 1 | Alias Symbol: I-plastin|Plastin-1 | ||
| Type: protein-coding gene | Cytoband: 3q23 | ||
| Entrez ID: 5357 | HGNC ID: HGNC:9090 | Ensembl Gene: ENSG00000120756 | OMIM ID: 602734 |
| Drug and gene relationship at DGIdb | |||
Expression of PLS1:
| Dataset | Gene | EntrezID | Probe | Log2FC | Adj.pValue | Expression |
|---|---|---|---|---|---|---|
| GSE17351 | PLS1 | 5357 | 205190_at | -0.3732 | 0.7582 | |
| GSE20347 | PLS1 | 5357 | 205190_at | -0.9329 | 0.0012 | |
| GSE23400 | PLS1 | 5357 | 205190_at | -0.9469 | 0.0000 | |
| GSE26886 | PLS1 | 5357 | 205190_at | -3.0631 | 0.0000 | |
| GSE29001 | PLS1 | 5357 | 205190_at | -1.4789 | 0.0005 | |
| GSE38129 | PLS1 | 5357 | 205190_at | -0.6359 | 0.0981 | |
| GSE45670 | PLS1 | 5357 | 205190_at | -0.2569 | 0.4754 | |
| GSE53622 | PLS1 | 5357 | 111483 | -1.3437 | 0.0000 | |
| GSE53624 | PLS1 | 5357 | 111483 | -1.7879 | 0.0000 | |
| GSE63941 | PLS1 | 5357 | 205190_at | 5.4489 | 0.0000 | |
| GSE77861 | PLS1 | 5357 | 205190_at | -1.6409 | 0.0460 | |
| GSE97050 | PLS1 | 5357 | A_23_P211909 | 0.1354 | 0.4986 | |
| SRP007169 | PLS1 | 5357 | RNAseq | -1.1050 | 0.0292 | |
| SRP008496 | PLS1 | 5357 | RNAseq | -1.6615 | 0.0000 | |
| SRP064894 | PLS1 | 5357 | RNAseq | -1.5606 | 0.0001 | |
| SRP133303 | PLS1 | 5357 | RNAseq | -0.4515 | 0.2888 | |
| SRP159526 | PLS1 | 5357 | RNAseq | -1.5557 | 0.0001 | |
| SRP193095 | PLS1 | 5357 | RNAseq | -2.0407 | 0.0000 | |
| SRP219564 | PLS1 | 5357 | RNAseq | -1.5757 | 0.0809 | |
| TCGA | PLS1 | 5357 | RNAseq | -0.3820 | 0.0137 |
Upregulated datasets: 1; Downregulated datasets: 10.
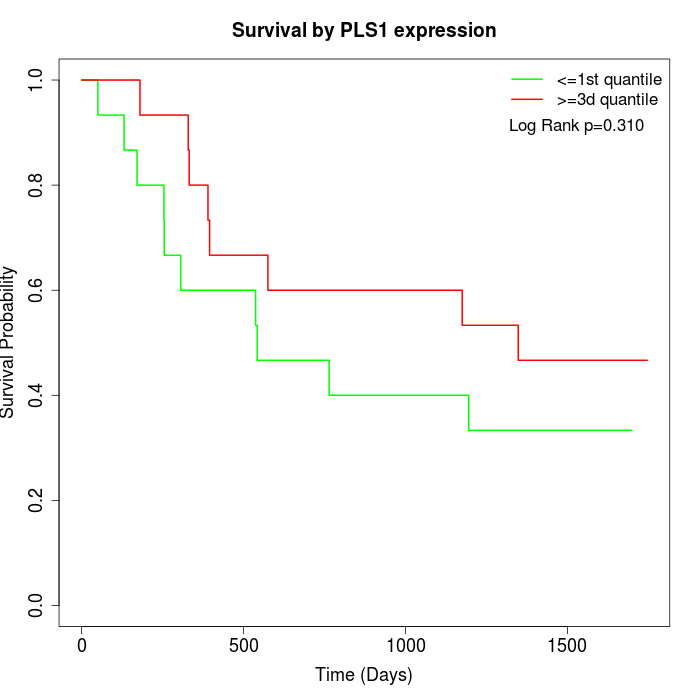
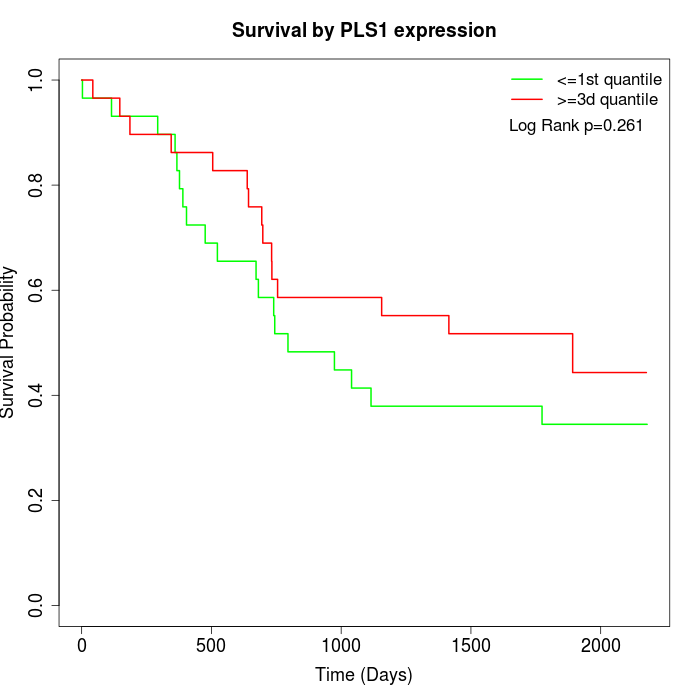
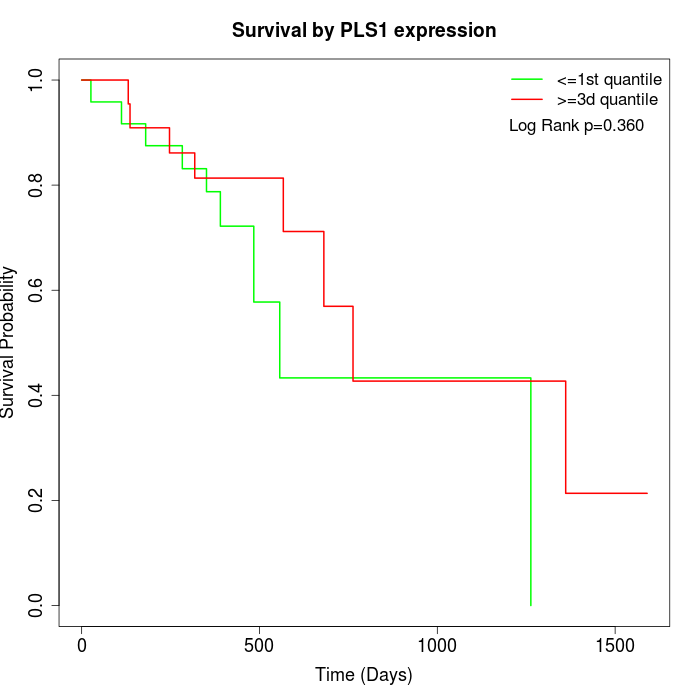
Survival by PLS1 expression:
Note: Click image to view full size file.
Copy number change of PLS1:
| Dataset | Gene | EntrezID | Gain | Loss | Normal | Detail |
|---|---|---|---|---|---|---|
| GSE15526 | PLS1 | 5357 | 21 | 0 | 9 | |
| GSE20123 | PLS1 | 5357 | 21 | 0 | 9 | |
| GSE43470 | PLS1 | 5357 | 22 | 0 | 21 | |
| GSE46452 | PLS1 | 5357 | 15 | 4 | 40 | |
| GSE47630 | PLS1 | 5357 | 19 | 3 | 18 | |
| GSE54993 | PLS1 | 5357 | 1 | 8 | 61 | |
| GSE54994 | PLS1 | 5357 | 34 | 1 | 18 | |
| GSE60625 | PLS1 | 5357 | 0 | 6 | 5 | |
| GSE74703 | PLS1 | 5357 | 19 | 0 | 17 | |
| GSE74704 | PLS1 | 5357 | 14 | 0 | 6 | |
| TCGA | PLS1 | 5357 | 64 | 3 | 29 |
Total number of gains: 230; Total number of losses: 25; Total Number of normals: 233.
Somatic mutations of PLS1:
Generating mutation plots.
Highly correlated genes for PLS1:
Showing top 20/1178 corelated genes with mean PCC>0.5.
| Gene1 | Gene2 | Mean PCC | Num. Datasets | Num. PCC<0 | Num. PCC>0.5 |
|---|---|---|---|---|---|
| PLS1 | AAGAB | 0.789626 | 3 | 0 | 3 |
| PLS1 | RNF144B | 0.786023 | 3 | 0 | 3 |
| PLS1 | IMPACT | 0.761463 | 3 | 0 | 3 |
| PLS1 | C15orf48 | 0.73744 | 5 | 0 | 5 |
| PLS1 | PEX2 | 0.737108 | 3 | 0 | 3 |
| PLS1 | USP54 | 0.734861 | 7 | 0 | 7 |
| PLS1 | TP53RK | 0.727242 | 3 | 0 | 3 |
| PLS1 | SLC10A5 | 0.722748 | 3 | 0 | 3 |
| PLS1 | SDR16C5 | 0.72231 | 5 | 0 | 5 |
| PLS1 | ULK3 | 0.716859 | 7 | 0 | 7 |
| PLS1 | RBM47 | 0.714058 | 12 | 0 | 11 |
| PLS1 | IL1RAP | 0.713855 | 3 | 0 | 3 |
| PLS1 | CCNDBP1 | 0.71214 | 5 | 0 | 5 |
| PLS1 | PRSS8 | 0.709358 | 7 | 0 | 7 |
| PLS1 | ARHGAP27 | 0.709248 | 8 | 0 | 8 |
| PLS1 | MPZL3 | 0.707687 | 8 | 0 | 8 |
| PLS1 | RAD23B | 0.706668 | 4 | 0 | 4 |
| PLS1 | KIF21A | 0.706079 | 6 | 0 | 6 |
| PLS1 | RNFT1 | 0.704053 | 4 | 0 | 3 |
| PLS1 | CA13 | 0.703079 | 3 | 0 | 3 |
For details and further investigation, click here


