| Full name: proline and serine rich 1 | Alias Symbol: bA50D16.2|FLJ12661 | ||
| Type: protein-coding gene | Cytoband: 13q13.3 | ||
| Entrez ID: 80209 | HGNC ID: HGNC:20291 | Ensembl Gene: ENSG00000120685 | OMIM ID: |
Expression of PROSER1:
| Dataset | Gene | EntrezID | Probe | Log2FC | Adj.pValue | Expression |
|---|---|---|---|---|---|---|
| GSE17351 | PROSER1 | 80209 | 225887_at | 0.6426 | 0.4067 | |
| GSE20347 | PROSER1 | 80209 | 218420_s_at | -0.1217 | 0.3581 | |
| GSE23400 | PROSER1 | 80209 | 218420_s_at | -0.0404 | 0.5151 | |
| GSE26886 | PROSER1 | 80209 | 225887_at | -0.3045 | 0.5959 | |
| GSE29001 | PROSER1 | 80209 | 218420_s_at | -0.2136 | 0.3322 | |
| GSE38129 | PROSER1 | 80209 | 218420_s_at | 0.0794 | 0.5635 | |
| GSE45670 | PROSER1 | 80209 | 225887_at | 0.1098 | 0.5483 | |
| GSE53622 | PROSER1 | 80209 | 42347 | 0.1540 | 0.0612 | |
| GSE53624 | PROSER1 | 80209 | 15231 | 0.1063 | 0.1200 | |
| GSE63941 | PROSER1 | 80209 | 225887_at | -0.0025 | 0.9970 | |
| GSE77861 | PROSER1 | 80209 | 218420_s_at | -0.0815 | 0.7822 | |
| GSE97050 | PROSER1 | 80209 | A_33_P3398533 | 0.3788 | 0.1756 | |
| SRP007169 | PROSER1 | 80209 | RNAseq | 0.2686 | 0.5724 | |
| SRP008496 | PROSER1 | 80209 | RNAseq | 0.6902 | 0.1039 | |
| SRP064894 | PROSER1 | 80209 | RNAseq | 0.1711 | 0.4409 | |
| SRP133303 | PROSER1 | 80209 | RNAseq | -0.0554 | 0.7643 | |
| SRP159526 | PROSER1 | 80209 | RNAseq | -0.1530 | 0.3180 | |
| SRP193095 | PROSER1 | 80209 | RNAseq | -0.0657 | 0.5619 | |
| SRP219564 | PROSER1 | 80209 | RNAseq | -0.2774 | 0.3207 |
Upregulated datasets: 0; Downregulated datasets: 0.
Survival by PROSER1 expression:
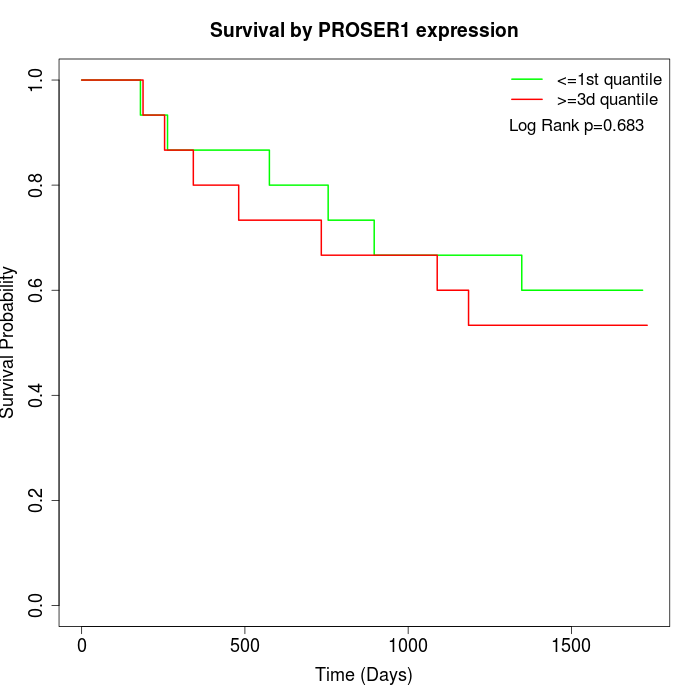 | 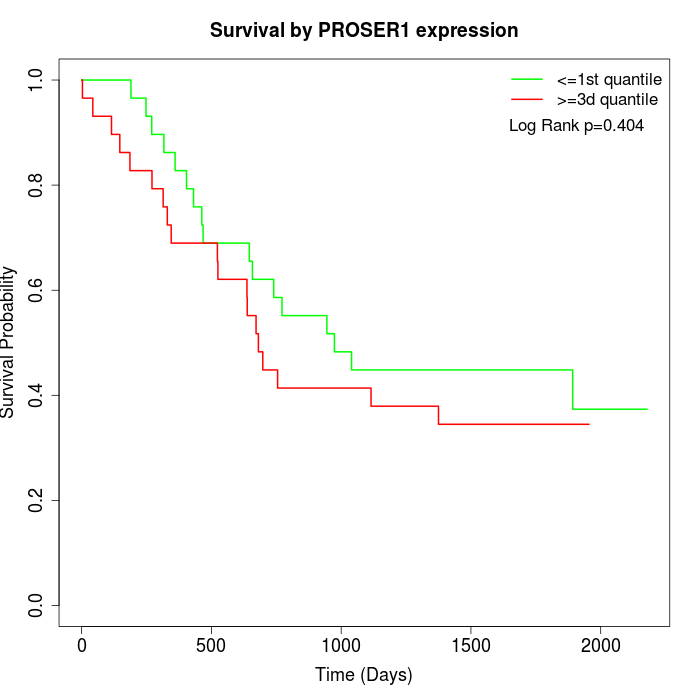 |
| GSE53622 | GSE53624 |
Note: Click image to view full size file.
Copy number change of PROSER1:
| Dataset | Gene | EntrezID | Gain | Loss | Normal | Detail |
|---|---|---|---|---|---|---|
| GSE15526 | PROSER1 | 80209 | 0 | 16 | 14 | |
| GSE20123 | PROSER1 | 80209 | 0 | 15 | 15 | |
| GSE43470 | PROSER1 | 80209 | 3 | 13 | 27 | |
| GSE46452 | PROSER1 | 80209 | 0 | 33 | 26 | |
| GSE47630 | PROSER1 | 80209 | 2 | 27 | 11 | |
| GSE54993 | PROSER1 | 80209 | 12 | 2 | 56 | |
| GSE54994 | PROSER1 | 80209 | 1 | 17 | 35 | |
| GSE60625 | PROSER1 | 80209 | 0 | 3 | 8 | |
| GSE74703 | PROSER1 | 80209 | 3 | 10 | 23 | |
| GSE74704 | PROSER1 | 80209 | 0 | 12 | 8 | |
| TCGA | PROSER1 | 80209 | 7 | 40 | 49 |
Total number of gains: 28; Total number of losses: 188; Total Number of normals: 272.
Somatic mutations of PROSER1:
Generating mutation plots.
Highly correlated genes for PROSER1:
Showing top 20/320 corelated genes with mean PCC>0.5.
| Gene1 | Gene2 | Mean PCC | Num. Datasets | Num. PCC<0 | Num. PCC>0.5 |
|---|---|---|---|---|---|
| PROSER1 | ZNF3 | 0.873366 | 3 | 0 | 3 |
| PROSER1 | UPF1 | 0.816324 | 3 | 0 | 3 |
| PROSER1 | RNF135 | 0.800111 | 3 | 0 | 3 |
| PROSER1 | PTPN23 | 0.78152 | 3 | 0 | 3 |
| PROSER1 | C6orf136 | 0.780178 | 3 | 0 | 3 |
| PROSER1 | RBBP6 | 0.769447 | 3 | 0 | 3 |
| PROSER1 | ZNF567 | 0.759892 | 3 | 0 | 3 |
| PROSER1 | RAB1B | 0.756058 | 3 | 0 | 3 |
| PROSER1 | RNF4 | 0.746674 | 3 | 0 | 3 |
| PROSER1 | ATXN7L3B | 0.745964 | 3 | 0 | 3 |
| PROSER1 | EI24 | 0.743822 | 4 | 0 | 3 |
| PROSER1 | RFNG | 0.740639 | 3 | 0 | 3 |
| PROSER1 | CBFA2T2 | 0.738431 | 3 | 0 | 3 |
| PROSER1 | ZC3H3 | 0.734239 | 3 | 0 | 3 |
| PROSER1 | DNAJC13 | 0.731236 | 3 | 0 | 3 |
| PROSER1 | TET2 | 0.72732 | 3 | 0 | 3 |
| PROSER1 | SMARCA4 | 0.724976 | 3 | 0 | 3 |
| PROSER1 | UBAP2 | 0.723748 | 3 | 0 | 3 |
| PROSER1 | ACSL1 | 0.723608 | 3 | 0 | 3 |
| PROSER1 | VRK3 | 0.720512 | 4 | 0 | 4 |
For details and further investigation, click here