| Full name: presenilin 2 | Alias Symbol: AD3L|STM2|PS2 | ||
| Type: protein-coding gene | Cytoband: 1q42.13 | ||
| Entrez ID: 5664 | HGNC ID: HGNC:9509 | Ensembl Gene: ENSG00000143801 | OMIM ID: 600759 |
| Drug and gene relationship at DGIdb | |||
PSEN2 involved pathways:
| KEGG pathway | Description | View |
|---|---|---|
| hsa04330 | Notch signaling pathway | |
| hsa05010 | Alzheimer's disease |
Expression of PSEN2:
| Dataset | Gene | EntrezID | Probe | Log2FC | Adj.pValue | Expression |
|---|---|---|---|---|---|---|
| GSE17351 | PSEN2 | 5664 | 204262_s_at | -0.1779 | 0.6626 | |
| GSE20347 | PSEN2 | 5664 | 211373_s_at | -0.3744 | 0.0393 | |
| GSE23400 | PSEN2 | 5664 | 211373_s_at | -0.3008 | 0.0000 | |
| GSE26886 | PSEN2 | 5664 | 211373_s_at | 0.1975 | 0.5024 | |
| GSE29001 | PSEN2 | 5664 | 211373_s_at | -0.6218 | 0.0529 | |
| GSE38129 | PSEN2 | 5664 | 204262_s_at | -0.1194 | 0.5201 | |
| GSE45670 | PSEN2 | 5664 | 204262_s_at | 0.0332 | 0.8474 | |
| GSE53622 | PSEN2 | 5664 | 137023 | -0.6931 | 0.0000 | |
| GSE53624 | PSEN2 | 5664 | 137023 | -0.4960 | 0.0000 | |
| GSE63941 | PSEN2 | 5664 | 204262_s_at | -0.7105 | 0.0748 | |
| GSE77861 | PSEN2 | 5664 | 211373_s_at | -0.3662 | 0.0711 | |
| GSE97050 | PSEN2 | 5664 | A_23_P103398 | -0.0742 | 0.7896 | |
| SRP007169 | PSEN2 | 5664 | RNAseq | -1.6276 | 0.0051 | |
| SRP064894 | PSEN2 | 5664 | RNAseq | 0.0399 | 0.8537 | |
| SRP133303 | PSEN2 | 5664 | RNAseq | 0.0265 | 0.9120 | |
| SRP159526 | PSEN2 | 5664 | RNAseq | 0.0136 | 0.9748 | |
| SRP193095 | PSEN2 | 5664 | RNAseq | 0.0245 | 0.8785 | |
| SRP219564 | PSEN2 | 5664 | RNAseq | 0.0033 | 0.9933 | |
| TCGA | PSEN2 | 5664 | RNAseq | -0.1544 | 0.1119 |
Upregulated datasets: 0; Downregulated datasets: 1.
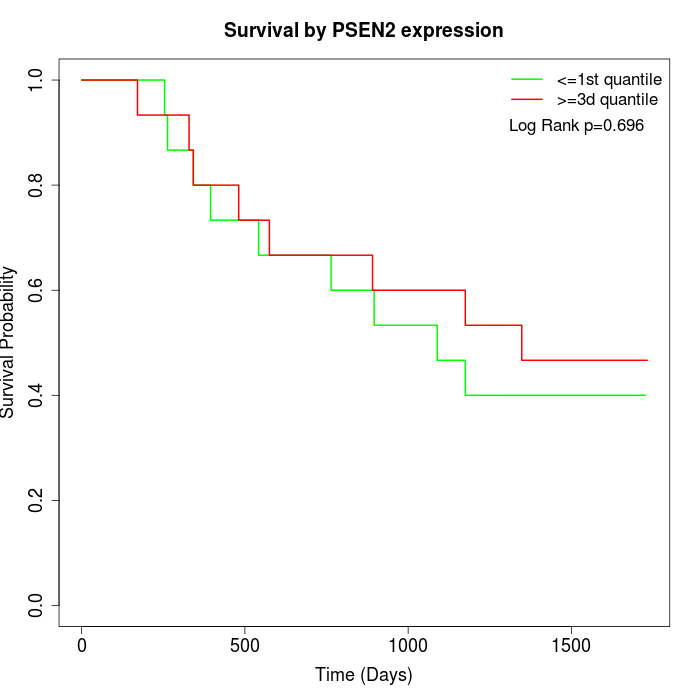
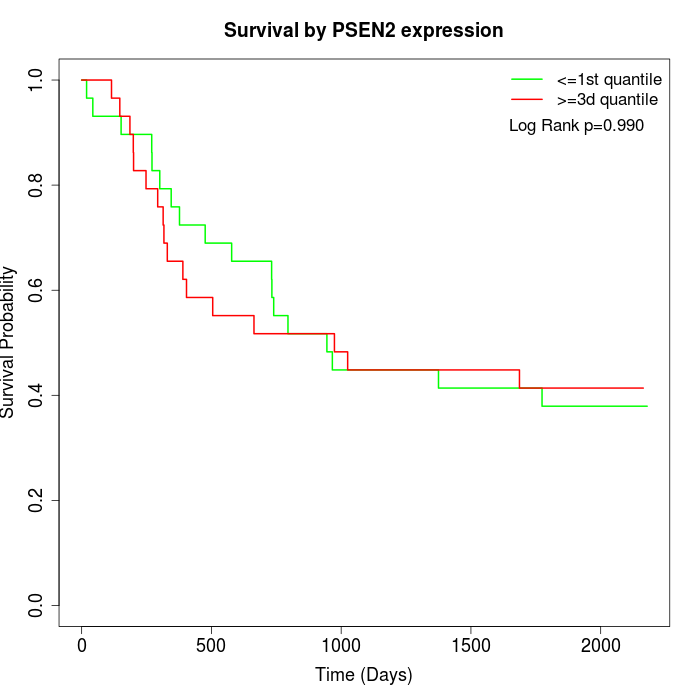
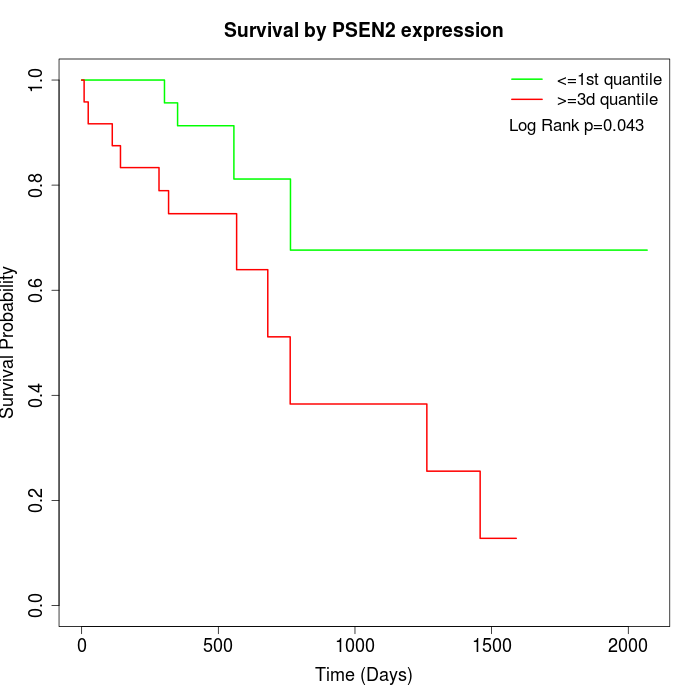
Survival by PSEN2 expression:
Note: Click image to view full size file.
Copy number change of PSEN2:
| Dataset | Gene | EntrezID | Gain | Loss | Normal | Detail |
|---|---|---|---|---|---|---|
| GSE15526 | PSEN2 | 5664 | 11 | 0 | 19 | |
| GSE20123 | PSEN2 | 5664 | 11 | 0 | 19 | |
| GSE43470 | PSEN2 | 5664 | 7 | 1 | 35 | |
| GSE46452 | PSEN2 | 5664 | 3 | 1 | 55 | |
| GSE47630 | PSEN2 | 5664 | 15 | 0 | 25 | |
| GSE54993 | PSEN2 | 5664 | 0 | 6 | 64 | |
| GSE54994 | PSEN2 | 5664 | 16 | 0 | 37 | |
| GSE60625 | PSEN2 | 5664 | 0 | 0 | 11 | |
| GSE74703 | PSEN2 | 5664 | 7 | 1 | 28 | |
| GSE74704 | PSEN2 | 5664 | 5 | 0 | 15 | |
| TCGA | PSEN2 | 5664 | 46 | 3 | 47 |
Total number of gains: 121; Total number of losses: 12; Total Number of normals: 355.
Somatic mutations of PSEN2:
Generating mutation plots.
Highly correlated genes for PSEN2:
Showing top 20/539 corelated genes with mean PCC>0.5.
| Gene1 | Gene2 | Mean PCC | Num. Datasets | Num. PCC<0 | Num. PCC>0.5 |
|---|---|---|---|---|---|
| PSEN2 | TMEM184C | 0.77684 | 3 | 0 | 3 |
| PSEN2 | HOOK3 | 0.754436 | 3 | 0 | 3 |
| PSEN2 | PANK4 | 0.732903 | 3 | 0 | 3 |
| PSEN2 | ARHGAP44 | 0.727079 | 3 | 0 | 3 |
| PSEN2 | CNIH3 | 0.723128 | 3 | 0 | 3 |
| PSEN2 | GHITM | 0.714845 | 3 | 0 | 3 |
| PSEN2 | FBXO10 | 0.710932 | 4 | 0 | 3 |
| PSEN2 | STXBP4 | 0.710112 | 3 | 0 | 3 |
| PSEN2 | EXOC4 | 0.707752 | 3 | 0 | 3 |
| PSEN2 | ENG | 0.707418 | 3 | 0 | 3 |
| PSEN2 | TBC1D20 | 0.701639 | 4 | 0 | 4 |
| PSEN2 | RGS3 | 0.698152 | 3 | 0 | 3 |
| PSEN2 | GTPBP1 | 0.696826 | 4 | 0 | 4 |
| PSEN2 | GFPT2 | 0.693528 | 3 | 0 | 3 |
| PSEN2 | AADAT | 0.693445 | 3 | 0 | 3 |
| PSEN2 | NECAP2 | 0.692003 | 3 | 0 | 3 |
| PSEN2 | ANAPC16 | 0.691816 | 3 | 0 | 3 |
| PSEN2 | MAP1LC3A | 0.691547 | 3 | 0 | 3 |
| PSEN2 | USP54 | 0.683816 | 4 | 0 | 3 |
| PSEN2 | STOML1 | 0.682245 | 3 | 0 | 3 |
For details and further investigation, click here


