| Full name: proteasome subunit beta 10 | Alias Symbol: LMP10|MGC1665|beta2i | ||
| Type: protein-coding gene | Cytoband: 16q22.1 | ||
| Entrez ID: 5699 | HGNC ID: HGNC:9538 | Ensembl Gene: ENSG00000205220 | OMIM ID: 176847 |
| Related drugs: BORTEZOMIB, CARFILZOMIB, IXAZOMIB CITRATE, MARIZOMIB, OPROZOMIB... [more] | |||
Expression of PSMB10:
| Dataset | Gene | EntrezID | Probe | Log2FC | Adj.pValue | Expression |
|---|---|---|---|---|---|---|
| GSE17351 | PSMB10 | 5699 | 202659_at | 0.8052 | 0.1149 | |
| GSE20347 | PSMB10 | 5699 | 202659_at | 0.3903 | 0.1223 | |
| GSE23400 | PSMB10 | 5699 | 202659_at | 0.4076 | 0.0015 | |
| GSE26886 | PSMB10 | 5699 | 202659_at | 0.9591 | 0.0056 | |
| GSE29001 | PSMB10 | 5699 | 202659_at | 0.5752 | 0.0930 | |
| GSE38129 | PSMB10 | 5699 | 202659_at | 0.2893 | 0.1663 | |
| GSE45670 | PSMB10 | 5699 | 202659_at | 0.5598 | 0.0666 | |
| GSE53622 | PSMB10 | 5699 | 25394 | 0.5779 | 0.0000 | |
| GSE53624 | PSMB10 | 5699 | 25394 | 0.7607 | 0.0000 | |
| GSE63941 | PSMB10 | 5699 | 202659_at | -0.5530 | 0.5631 | |
| GSE77861 | PSMB10 | 5699 | 202659_at | 0.1017 | 0.6264 | |
| GSE97050 | PSMB10 | 5699 | A_33_P3288359 | 0.4341 | 0.1817 | |
| SRP007169 | PSMB10 | 5699 | RNAseq | 0.5492 | 0.3134 | |
| SRP008496 | PSMB10 | 5699 | RNAseq | 0.5824 | 0.1918 | |
| SRP064894 | PSMB10 | 5699 | RNAseq | 1.1805 | 0.0027 | |
| SRP133303 | PSMB10 | 5699 | RNAseq | 0.6217 | 0.0099 | |
| SRP159526 | PSMB10 | 5699 | RNAseq | 0.2837 | 0.5568 | |
| SRP193095 | PSMB10 | 5699 | RNAseq | 0.1069 | 0.6627 | |
| SRP219564 | PSMB10 | 5699 | RNAseq | 1.1159 | 0.0140 | |
| TCGA | PSMB10 | 5699 | RNAseq | 0.1988 | 0.0476 |
Upregulated datasets: 2; Downregulated datasets: 0.
Survival by PSMB10 expression:
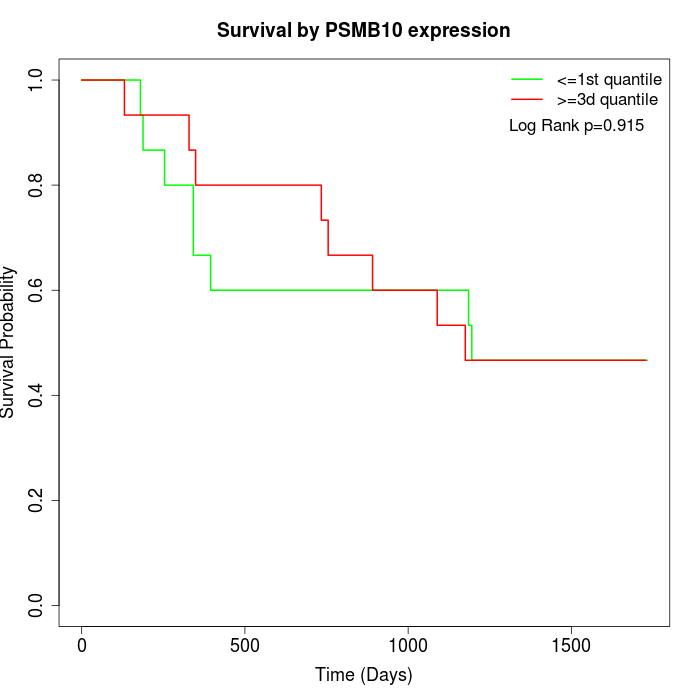 | 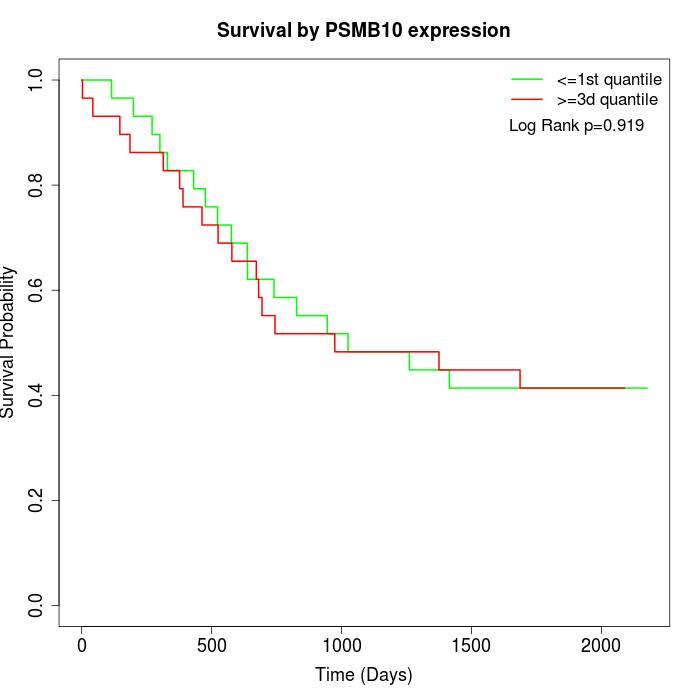 | 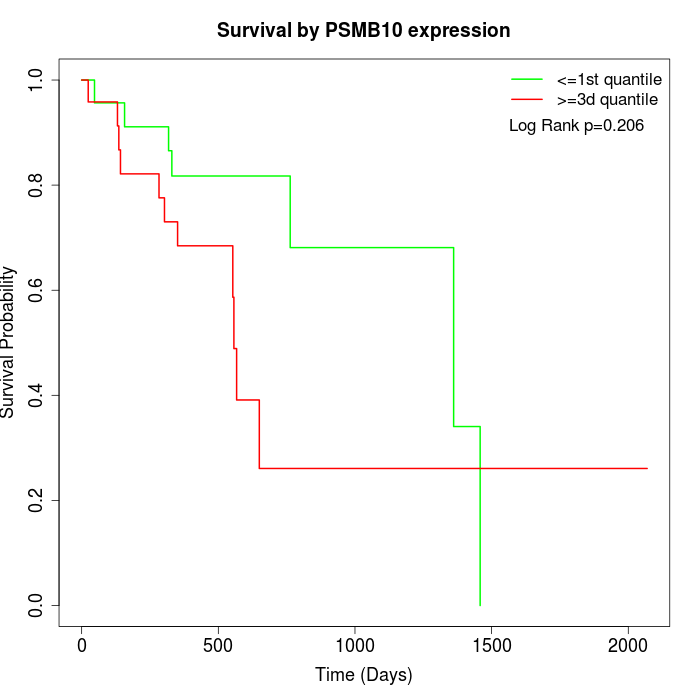 |
| GSE53622 | GSE53624 | TCGA |
Note: Click image to view full size file.
Copy number change of PSMB10:
| Dataset | Gene | EntrezID | Gain | Loss | Normal | Detail |
|---|---|---|---|---|---|---|
| GSE15526 | PSMB10 | 5699 | 9 | 2 | 19 | |
| GSE20123 | PSMB10 | 5699 | 9 | 2 | 19 | |
| GSE43470 | PSMB10 | 5699 | 1 | 9 | 33 | |
| GSE46452 | PSMB10 | 5699 | 38 | 1 | 20 | |
| GSE47630 | PSMB10 | 5699 | 11 | 8 | 21 | |
| GSE54993 | PSMB10 | 5699 | 2 | 4 | 64 | |
| GSE54994 | PSMB10 | 5699 | 8 | 10 | 35 | |
| GSE60625 | PSMB10 | 5699 | 4 | 0 | 7 | |
| GSE74703 | PSMB10 | 5699 | 1 | 6 | 29 | |
| GSE74704 | PSMB10 | 5699 | 5 | 1 | 14 | |
| TCGA | PSMB10 | 5699 | 30 | 12 | 54 |
Total number of gains: 118; Total number of losses: 55; Total Number of normals: 315.
Somatic mutations of PSMB10:
Generating mutation plots.
Highly correlated genes for PSMB10:
Showing top 20/813 corelated genes with mean PCC>0.5.
| Gene1 | Gene2 | Mean PCC | Num. Datasets | Num. PCC<0 | Num. PCC>0.5 |
|---|---|---|---|---|---|
| PSMB10 | PREX1 | 0.823784 | 3 | 0 | 3 |
| PSMB10 | SSBP4 | 0.769328 | 3 | 0 | 3 |
| PSMB10 | DHRSX | 0.750085 | 3 | 0 | 3 |
| PSMB10 | SLC39A3 | 0.725598 | 3 | 0 | 3 |
| PSMB10 | GOSR2 | 0.718202 | 3 | 0 | 3 |
| PSMB10 | PSMB8 | 0.717961 | 13 | 0 | 11 |
| PSMB10 | PARP14 | 0.713824 | 8 | 0 | 6 |
| PSMB10 | TUFM | 0.713338 | 3 | 0 | 3 |
| PSMB10 | WDR81 | 0.712688 | 4 | 0 | 3 |
| PSMB10 | NLRC5 | 0.711893 | 5 | 0 | 5 |
| PSMB10 | TIFAB | 0.710929 | 3 | 0 | 3 |
| PSMB10 | HAVCR2 | 0.710279 | 5 | 0 | 5 |
| PSMB10 | ERGIC3 | 0.708871 | 3 | 0 | 3 |
| PSMB10 | HLA-F | 0.706707 | 11 | 0 | 10 |
| PSMB10 | CMPK2 | 0.694936 | 7 | 0 | 7 |
| PSMB10 | SNX20 | 0.694747 | 4 | 0 | 3 |
| PSMB10 | LRRK1 | 0.693262 | 3 | 0 | 3 |
| PSMB10 | USP41 | 0.692587 | 3 | 0 | 3 |
| PSMB10 | PSMB9 | 0.690074 | 12 | 0 | 10 |
| PSMB10 | IFI35 | 0.689308 | 12 | 0 | 10 |
For details and further investigation, click here