| Full name: prostaglandin E synthase | Alias Symbol: MGST-IV|PIG12|MGST1-L1|TP53I12 | ||
| Type: protein-coding gene | Cytoband: 9q34.11 | ||
| Entrez ID: 9536 | HGNC ID: HGNC:9599 | Ensembl Gene: ENSG00000148344 | OMIM ID: 605172 |
| Drug and gene relationship at DGIdb | |||
Expression of PTGES:
| Dataset | Gene | EntrezID | Probe | Log2FC | Adj.pValue | Expression |
|---|---|---|---|---|---|---|
| GSE17351 | PTGES | 9536 | 210367_s_at | 1.9300 | 0.0877 | |
| GSE20347 | PTGES | 9536 | 210367_s_at | 0.8305 | 0.0077 | |
| GSE23400 | PTGES | 9536 | 210367_s_at | 0.3684 | 0.0003 | |
| GSE26886 | PTGES | 9536 | 210367_s_at | 1.6561 | 0.0023 | |
| GSE29001 | PTGES | 9536 | 210367_s_at | 0.8769 | 0.0104 | |
| GSE38129 | PTGES | 9536 | 210367_s_at | 0.7088 | 0.0093 | |
| GSE45670 | PTGES | 9536 | 210367_s_at | 1.2199 | 0.0001 | |
| GSE53622 | PTGES | 9536 | 45002 | 0.4579 | 0.0006 | |
| GSE53624 | PTGES | 9536 | 45002 | 0.6390 | 0.0000 | |
| GSE63941 | PTGES | 9536 | 210367_s_at | -2.2718 | 0.1403 | |
| GSE77861 | PTGES | 9536 | 210367_s_at | 0.8192 | 0.0769 | |
| GSE97050 | PTGES | 9536 | A_24_P403417 | 1.1896 | 0.1148 | |
| SRP007169 | PTGES | 9536 | RNAseq | 1.4233 | 0.0728 | |
| SRP008496 | PTGES | 9536 | RNAseq | 0.9279 | 0.1054 | |
| SRP064894 | PTGES | 9536 | RNAseq | 0.9444 | 0.0144 | |
| SRP133303 | PTGES | 9536 | RNAseq | 0.9475 | 0.0006 | |
| SRP159526 | PTGES | 9536 | RNAseq | 0.6711 | 0.2079 | |
| SRP193095 | PTGES | 9536 | RNAseq | 1.6658 | 0.0000 | |
| TCGA | PTGES | 9536 | RNAseq | 0.8638 | 0.0000 |
Upregulated datasets: 3; Downregulated datasets: 0.
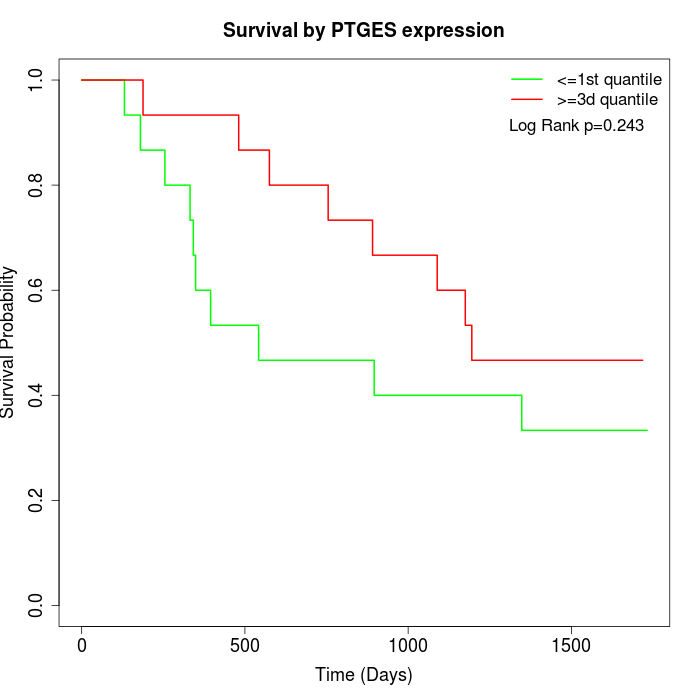
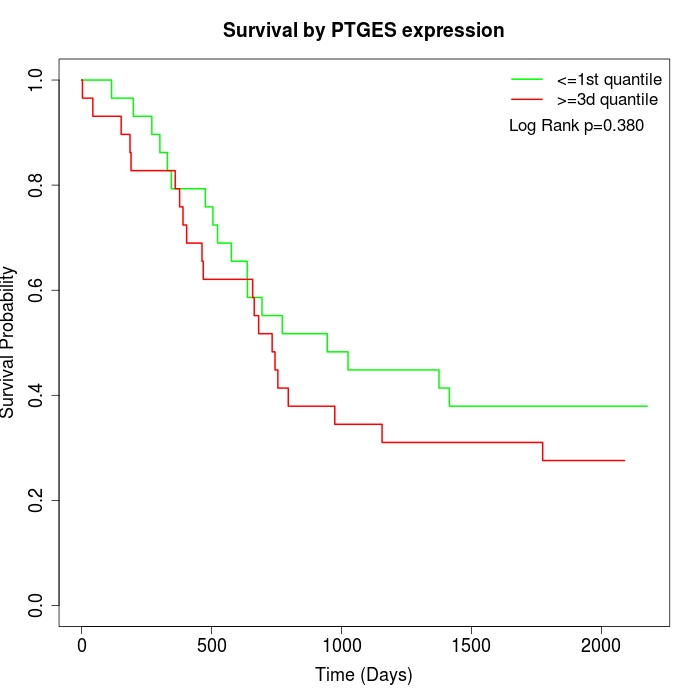
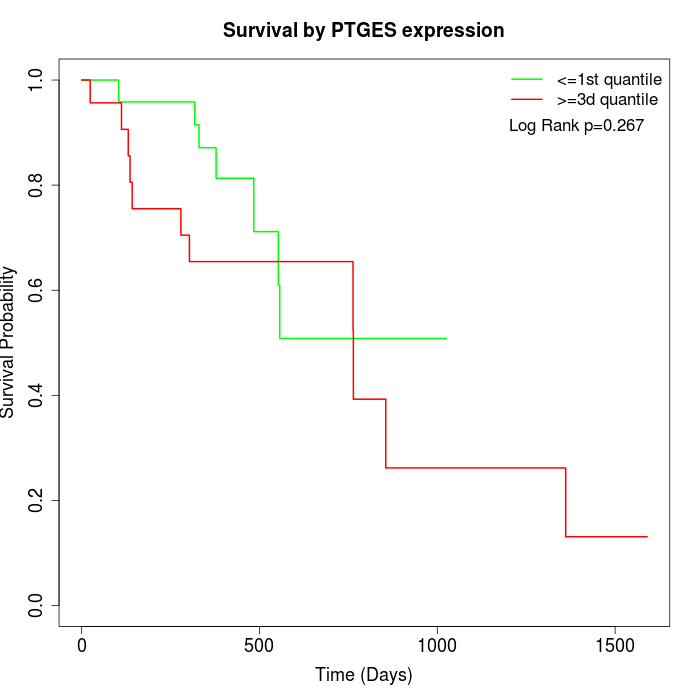
Survival by PTGES expression:
Note: Click image to view full size file.
Copy number change of PTGES:
| Dataset | Gene | EntrezID | Gain | Loss | Normal | Detail |
|---|---|---|---|---|---|---|
| GSE15526 | PTGES | 9536 | 6 | 9 | 15 | |
| GSE20123 | PTGES | 9536 | 6 | 9 | 15 | |
| GSE43470 | PTGES | 9536 | 5 | 7 | 31 | |
| GSE46452 | PTGES | 9536 | 6 | 13 | 40 | |
| GSE47630 | PTGES | 9536 | 3 | 16 | 21 | |
| GSE54993 | PTGES | 9536 | 3 | 3 | 64 | |
| GSE54994 | PTGES | 9536 | 12 | 9 | 32 | |
| GSE60625 | PTGES | 9536 | 0 | 0 | 11 | |
| GSE74703 | PTGES | 9536 | 5 | 5 | 26 | |
| GSE74704 | PTGES | 9536 | 3 | 7 | 10 | |
| TCGA | PTGES | 9536 | 27 | 26 | 43 |
Total number of gains: 76; Total number of losses: 104; Total Number of normals: 308.
Somatic mutations of PTGES:
Generating mutation plots.
Highly correlated genes for PTGES:
Showing top 20/788 corelated genes with mean PCC>0.5.
| Gene1 | Gene2 | Mean PCC | Num. Datasets | Num. PCC<0 | Num. PCC>0.5 |
|---|---|---|---|---|---|
| PTGES | TDRD5 | 0.771633 | 3 | 0 | 3 |
| PTGES | KIF20B | 0.767174 | 3 | 0 | 3 |
| PTGES | SLBP | 0.759006 | 4 | 0 | 4 |
| PTGES | SLC25A19 | 0.753454 | 3 | 0 | 3 |
| PTGES | GEN1 | 0.724264 | 4 | 0 | 3 |
| PTGES | CENPL | 0.713207 | 5 | 0 | 5 |
| PTGES | PRR13 | 0.704701 | 3 | 0 | 3 |
| PTGES | TMTC4 | 0.700275 | 3 | 0 | 3 |
| PTGES | C12orf73 | 0.70016 | 3 | 0 | 3 |
| PTGES | TMEM216 | 0.698906 | 4 | 0 | 4 |
| PTGES | LIN9 | 0.698804 | 4 | 0 | 3 |
| PTGES | ANGEL2 | 0.696954 | 3 | 0 | 3 |
| PTGES | ZBTB2 | 0.691901 | 3 | 0 | 3 |
| PTGES | SPATA2 | 0.69092 | 3 | 0 | 3 |
| PTGES | DNAJC10 | 0.683408 | 3 | 0 | 3 |
| PTGES | SMC3 | 0.682049 | 3 | 0 | 3 |
| PTGES | CENPBD1 | 0.681369 | 4 | 0 | 4 |
| PTGES | NOP14 | 0.681328 | 4 | 0 | 3 |
| PTGES | TLCD1 | 0.678137 | 3 | 0 | 3 |
| PTGES | CENPK | 0.67739 | 4 | 0 | 4 |
For details and further investigation, click here


