| Full name: prostaglandin-endoperoxide synthase 2 | Alias Symbol: COX2 | ||
| Type: protein-coding gene | Cytoband: 1q31.1 | ||
| Entrez ID: 5743 | HGNC ID: HGNC:9605 | Ensembl Gene: ENSG00000073756 | OMIM ID: 600262 |
| Related drugs: ACETAMINOPHEN, AMINOSALICYLATE POTASSIUM, AMINOSALICYLATE SODIUM, APRICOXIB, ARUNDIC ACID, ASPIRIN, BALSALAZID, BALSALAZIDE DISODIUM, BISMUTH SUBSALICYLATE, BROMFENAC... [more] | |||
PTGS2 involved pathways:
Expression of PTGS2:
| Dataset | Gene | EntrezID | Probe | Log2FC | Adj.pValue | Expression |
|---|---|---|---|---|---|---|
| GSE17351 | PTGS2 | 5743 | 204748_at | 0.7315 | 0.7042 | |
| GSE20347 | PTGS2 | 5743 | 204748_at | 0.9475 | 0.2218 | |
| GSE23400 | PTGS2 | 5743 | 204748_at | 0.4735 | 0.1051 | |
| GSE26886 | PTGS2 | 5743 | 204748_at | 2.5272 | 0.0016 | |
| GSE29001 | PTGS2 | 5743 | 204748_at | 0.4653 | 0.6515 | |
| GSE38129 | PTGS2 | 5743 | 204748_at | 0.3095 | 0.6196 | |
| GSE45670 | PTGS2 | 5743 | 204748_at | -0.1023 | 0.9281 | |
| GSE53622 | PTGS2 | 5743 | 107781 | 0.5658 | 0.0518 | |
| GSE53624 | PTGS2 | 5743 | 107781 | 0.8370 | 0.0002 | |
| GSE63941 | PTGS2 | 5743 | 204748_at | -3.3668 | 0.0873 | |
| GSE77861 | PTGS2 | 5743 | 204748_at | 1.4963 | 0.0709 | |
| GSE97050 | PTGS2 | 5743 | A_24_P250922 | 0.3116 | 0.5580 | |
| SRP007169 | PTGS2 | 5743 | RNAseq | 1.9266 | 0.0217 | |
| SRP008496 | PTGS2 | 5743 | RNAseq | 0.8624 | 0.2487 | |
| SRP064894 | PTGS2 | 5743 | RNAseq | 1.0315 | 0.0681 | |
| SRP133303 | PTGS2 | 5743 | RNAseq | 1.3935 | 0.0010 | |
| SRP159526 | PTGS2 | 5743 | RNAseq | 1.4356 | 0.0212 | |
| SRP193095 | PTGS2 | 5743 | RNAseq | 2.3628 | 0.0000 | |
| SRP219564 | PTGS2 | 5743 | RNAseq | 2.0604 | 0.0215 | |
| TCGA | PTGS2 | 5743 | RNAseq | 0.3260 | 0.1232 |
Upregulated datasets: 6; Downregulated datasets: 0.
Survival by PTGS2 expression:
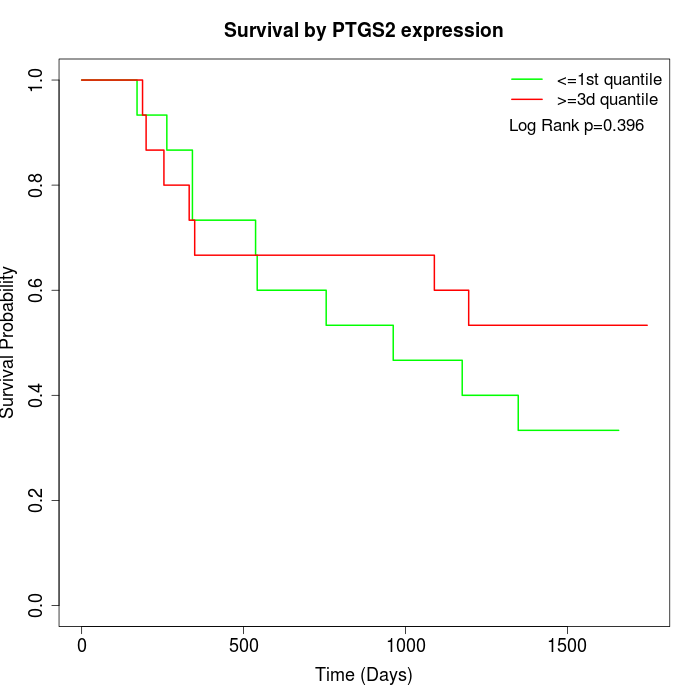 | 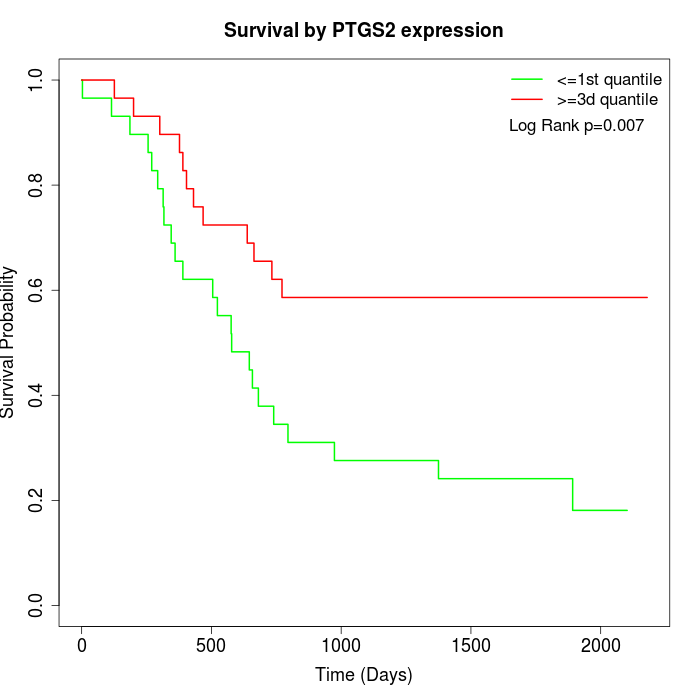 | 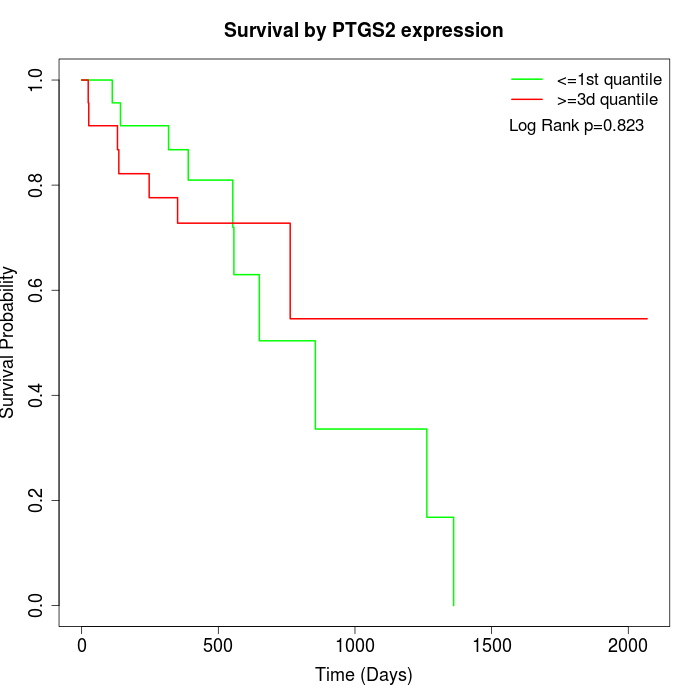 |
| GSE53622 | GSE53624 | TCGA |
Note: Click image to view full size file.
Copy number change of PTGS2:
| Dataset | Gene | EntrezID | Gain | Loss | Normal | Detail |
|---|---|---|---|---|---|---|
| GSE15526 | PTGS2 | 5743 | 10 | 0 | 20 | |
| GSE20123 | PTGS2 | 5743 | 10 | 0 | 20 | |
| GSE43470 | PTGS2 | 5743 | 6 | 1 | 36 | |
| GSE46452 | PTGS2 | 5743 | 3 | 1 | 55 | |
| GSE47630 | PTGS2 | 5743 | 14 | 0 | 26 | |
| GSE54993 | PTGS2 | 5743 | 0 | 6 | 64 | |
| GSE54994 | PTGS2 | 5743 | 15 | 0 | 38 | |
| GSE60625 | PTGS2 | 5743 | 0 | 0 | 11 | |
| GSE74703 | PTGS2 | 5743 | 6 | 1 | 29 | |
| GSE74704 | PTGS2 | 5743 | 4 | 0 | 16 | |
| TCGA | PTGS2 | 5743 | 40 | 4 | 52 |
Total number of gains: 108; Total number of losses: 13; Total Number of normals: 367.
Somatic mutations of PTGS2:
Generating mutation plots.
Highly correlated genes for PTGS2:
Showing top 20/378 corelated genes with mean PCC>0.5.
| Gene1 | Gene2 | Mean PCC | Num. Datasets | Num. PCC<0 | Num. PCC>0.5 |
|---|---|---|---|---|---|
| PTGS2 | PIF1 | 0.77643 | 3 | 0 | 3 |
| PTGS2 | KIAA0895L | 0.774506 | 3 | 0 | 3 |
| PTGS2 | NUDC | 0.762485 | 3 | 0 | 3 |
| PTGS2 | PRTFDC1 | 0.759883 | 3 | 0 | 3 |
| PTGS2 | PLOD3 | 0.74696 | 3 | 0 | 3 |
| PTGS2 | PET117 | 0.740323 | 3 | 0 | 3 |
| PTGS2 | UGGT2 | 0.74001 | 3 | 0 | 3 |
| PTGS2 | SLCO3A1 | 0.71331 | 3 | 0 | 3 |
| PTGS2 | GLA | 0.710314 | 3 | 0 | 3 |
| PTGS2 | DNAJC2 | 0.699454 | 3 | 0 | 3 |
| PTGS2 | DTYMK | 0.69342 | 3 | 0 | 3 |
| PTGS2 | TCF7L1 | 0.691218 | 4 | 0 | 4 |
| PTGS2 | CENPV | 0.690017 | 4 | 0 | 4 |
| PTGS2 | PDE7A | 0.688619 | 4 | 0 | 3 |
| PTGS2 | IDS | 0.688614 | 3 | 0 | 3 |
| PTGS2 | BRI3 | 0.686337 | 3 | 0 | 3 |
| PTGS2 | RBMX2 | 0.684477 | 3 | 0 | 3 |
| PTGS2 | PLCB4 | 0.684412 | 3 | 0 | 3 |
| PTGS2 | ESF1 | 0.682081 | 3 | 0 | 3 |
| PTGS2 | HMCN1 | 0.681795 | 3 | 0 | 3 |
For details and further investigation, click here