| Full name: protein tyrosine phosphatase non-receptor type 1 | Alias Symbol: | ||
| Type: protein-coding gene | Cytoband: 20q13.13 | ||
| Entrez ID: 5770 | HGNC ID: HGNC:9642 | Ensembl Gene: ENSG00000196396 | OMIM ID: 176885 |
| Related drugs: TILUDRONIC ACID, TRODUSQUEMINE... [more] | |||
Screen Evidence:
| |||
PTPN1 involved pathways:
| KEGG pathway | Description | View |
|---|---|---|
| hsa04520 | Adherens junction | |
| hsa04910 | Insulin signaling pathway | |
| hsa04931 | Insulin resistance |
Expression of PTPN1:
| Dataset | Gene | EntrezID | Probe | Log2FC | Adj.pValue | Expression |
|---|---|---|---|---|---|---|
| GSE17351 | PTPN1 | 5770 | 202716_at | 0.5296 | 0.2084 | |
| GSE20347 | PTPN1 | 5770 | 202716_at | 0.1261 | 0.3954 | |
| GSE23400 | PTPN1 | 5770 | 202716_at | 0.1517 | 0.0101 | |
| GSE26886 | PTPN1 | 5770 | 202716_at | -0.3376 | 0.0869 | |
| GSE29001 | PTPN1 | 5770 | 202716_at | 0.4001 | 0.0100 | |
| GSE38129 | PTPN1 | 5770 | 202716_at | 0.2758 | 0.1277 | |
| GSE45670 | PTPN1 | 5770 | 202716_at | 0.2143 | 0.2112 | |
| GSE53622 | PTPN1 | 5770 | 94182 | 0.3996 | 0.0000 | |
| GSE53624 | PTPN1 | 5770 | 94182 | 0.3812 | 0.0000 | |
| GSE63941 | PTPN1 | 5770 | 202716_at | -0.8609 | 0.1299 | |
| GSE77861 | PTPN1 | 5770 | 202716_at | 0.2225 | 0.2391 | |
| GSE97050 | PTPN1 | 5770 | A_23_P338890 | 0.2967 | 0.2433 | |
| SRP007169 | PTPN1 | 5770 | RNAseq | 0.5001 | 0.1863 | |
| SRP008496 | PTPN1 | 5770 | RNAseq | 0.3659 | 0.1007 | |
| SRP064894 | PTPN1 | 5770 | RNAseq | 0.3631 | 0.1272 | |
| SRP133303 | PTPN1 | 5770 | RNAseq | 0.4994 | 0.0000 | |
| SRP159526 | PTPN1 | 5770 | RNAseq | 0.1902 | 0.4097 | |
| SRP193095 | PTPN1 | 5770 | RNAseq | 0.4506 | 0.0000 | |
| SRP219564 | PTPN1 | 5770 | RNAseq | 0.6503 | 0.1494 | |
| TCGA | PTPN1 | 5770 | RNAseq | 0.1539 | 0.0009 |
Upregulated datasets: 0; Downregulated datasets: 0.
Survival by PTPN1 expression:
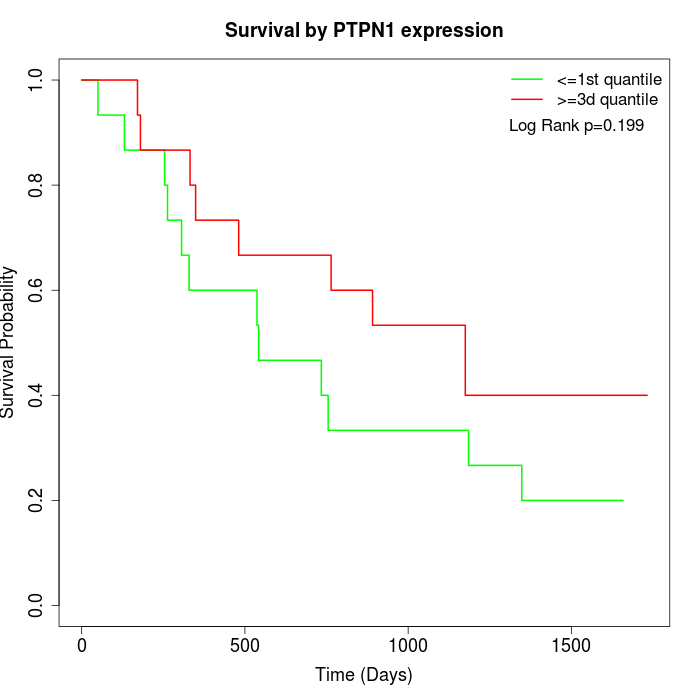 | 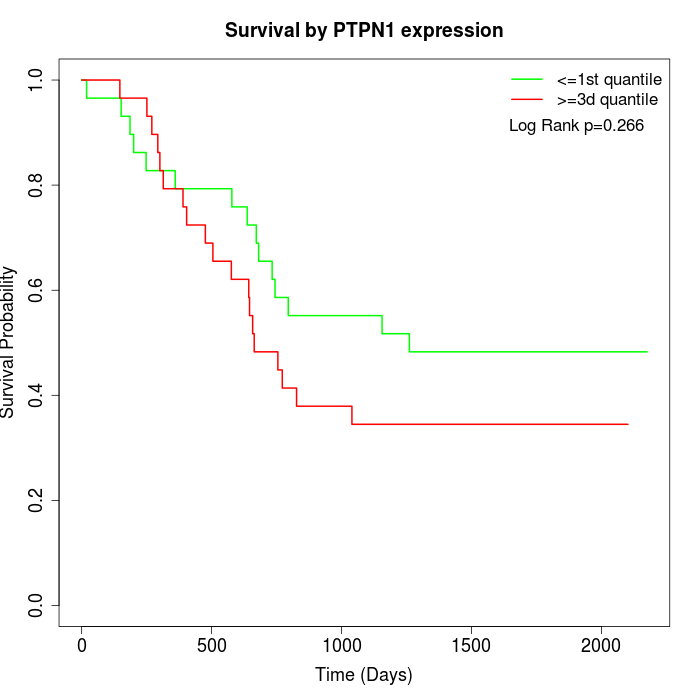 | 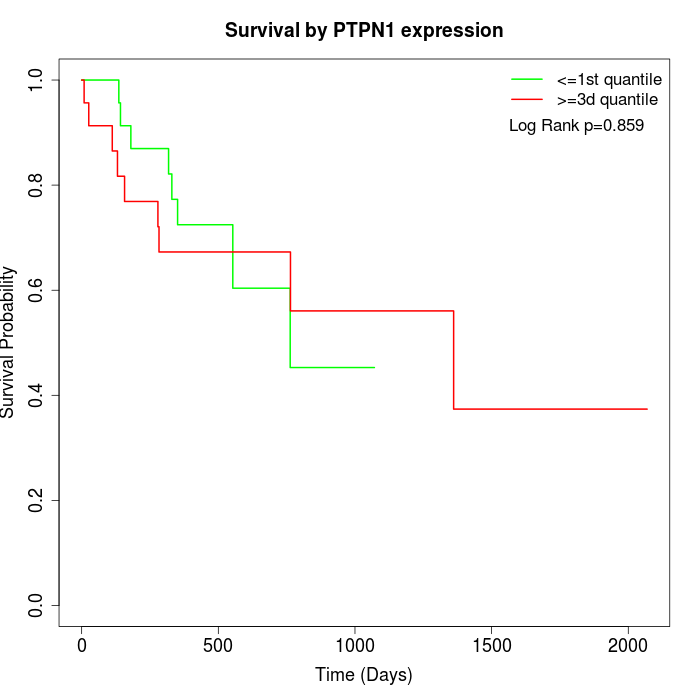 |
| GSE53622 | GSE53624 | TCGA |
Note: Click image to view full size file.
Copy number change of PTPN1:
| Dataset | Gene | EntrezID | Gain | Loss | Normal | Detail |
|---|---|---|---|---|---|---|
| GSE15526 | PTPN1 | 5770 | 17 | 2 | 11 | |
| GSE20123 | PTPN1 | 5770 | 17 | 2 | 11 | |
| GSE43470 | PTPN1 | 5770 | 13 | 0 | 30 | |
| GSE46452 | PTPN1 | 5770 | 29 | 0 | 30 | |
| GSE47630 | PTPN1 | 5770 | 24 | 1 | 15 | |
| GSE54993 | PTPN1 | 5770 | 0 | 17 | 53 | |
| GSE54994 | PTPN1 | 5770 | 27 | 0 | 26 | |
| GSE60625 | PTPN1 | 5770 | 0 | 0 | 11 | |
| GSE74703 | PTPN1 | 5770 | 11 | 0 | 25 | |
| GSE74704 | PTPN1 | 5770 | 13 | 0 | 7 | |
| TCGA | PTPN1 | 5770 | 47 | 3 | 46 |
Total number of gains: 198; Total number of losses: 25; Total Number of normals: 265.
Somatic mutations of PTPN1:
Generating mutation plots.
Highly correlated genes for PTPN1:
Showing top 20/552 corelated genes with mean PCC>0.5.
| Gene1 | Gene2 | Mean PCC | Num. Datasets | Num. PCC<0 | Num. PCC>0.5 |
|---|---|---|---|---|---|
| PTPN1 | VPS16 | 0.770554 | 3 | 0 | 3 |
| PTPN1 | TM9SF1 | 0.747433 | 3 | 0 | 3 |
| PTPN1 | NEK11 | 0.733656 | 3 | 0 | 3 |
| PTPN1 | GSPT2 | 0.732135 | 3 | 0 | 3 |
| PTPN1 | TAF1C | 0.729953 | 3 | 0 | 3 |
| PTPN1 | SGSH | 0.728073 | 3 | 0 | 3 |
| PTPN1 | AXL | 0.722143 | 3 | 0 | 3 |
| PTPN1 | UBXN1 | 0.721117 | 4 | 0 | 3 |
| PTPN1 | PRCC | 0.709915 | 3 | 0 | 3 |
| PTPN1 | MRPS18B | 0.707595 | 3 | 0 | 3 |
| PTPN1 | TBCB | 0.707042 | 3 | 0 | 3 |
| PTPN1 | PKIG | 0.705901 | 3 | 0 | 3 |
| PTPN1 | BCL7C | 0.704077 | 3 | 0 | 3 |
| PTPN1 | SMARCAL1 | 0.703741 | 3 | 0 | 3 |
| PTPN1 | ARMCX2 | 0.703571 | 3 | 0 | 3 |
| PTPN1 | ZMYM6 | 0.699646 | 4 | 0 | 4 |
| PTPN1 | MGMT | 0.697074 | 3 | 0 | 3 |
| PTPN1 | MFGE8 | 0.694221 | 3 | 0 | 3 |
| PTPN1 | TGM2 | 0.694147 | 3 | 0 | 3 |
| PTPN1 | GPS1 | 0.692602 | 3 | 0 | 3 |
For details and further investigation, click here