| Full name: heparanase 2 (inactive) | Alias Symbol: HPA2|HPR2 | ||
| Type: protein-coding gene | Cytoband: 10q24.2 | ||
| Entrez ID: 60495 | HGNC ID: HGNC:18374 | Ensembl Gene: ENSG00000172987 | OMIM ID: 613469 |
HPSE2 involved pathways:
| KEGG pathway | Description | View |
|---|---|---|
| hsa05205 | Proteoglycans in cancer |
Expression of HPSE2:
| Dataset | Gene | EntrezID | Probe | Log2FC | Adj.pValue | Expression |
|---|---|---|---|---|---|---|
| GSE17351 | HPSE2 | 60495 | 220927_s_at | -1.0350 | 0.1603 | |
| GSE20347 | HPSE2 | 60495 | 220927_s_at | -0.1297 | 0.1537 | |
| GSE23400 | HPSE2 | 60495 | 220927_s_at | -0.3669 | 0.0000 | |
| GSE26886 | HPSE2 | 60495 | 220927_s_at | -0.3250 | 0.0337 | |
| GSE29001 | HPSE2 | 60495 | 220927_s_at | -0.2794 | 0.0154 | |
| GSE38129 | HPSE2 | 60495 | 220927_s_at | -0.5190 | 0.0002 | |
| GSE45670 | HPSE2 | 60495 | 220927_s_at | -0.3646 | 0.0002 | |
| GSE53622 | HPSE2 | 60495 | 96091 | -3.0206 | 0.0000 | |
| GSE53624 | HPSE2 | 60495 | 96091 | -2.9740 | 0.0000 | |
| GSE63941 | HPSE2 | 60495 | 220927_s_at | 0.1960 | 0.0835 | |
| GSE77861 | HPSE2 | 60495 | 220927_s_at | -0.1773 | 0.1473 | |
| GSE97050 | HPSE2 | 60495 | A_23_P61707 | -2.1463 | 0.1126 | |
| SRP064894 | HPSE2 | 60495 | RNAseq | -1.2855 | 0.0181 | |
| SRP133303 | HPSE2 | 60495 | RNAseq | -1.3107 | 0.1823 | |
| SRP159526 | HPSE2 | 60495 | RNAseq | -1.5823 | 0.0468 | |
| SRP219564 | HPSE2 | 60495 | RNAseq | -1.1653 | 0.3969 | |
| TCGA | HPSE2 | 60495 | RNAseq | -1.4142 | 0.0378 |
Upregulated datasets: 0; Downregulated datasets: 5.
Survival by HPSE2 expression:
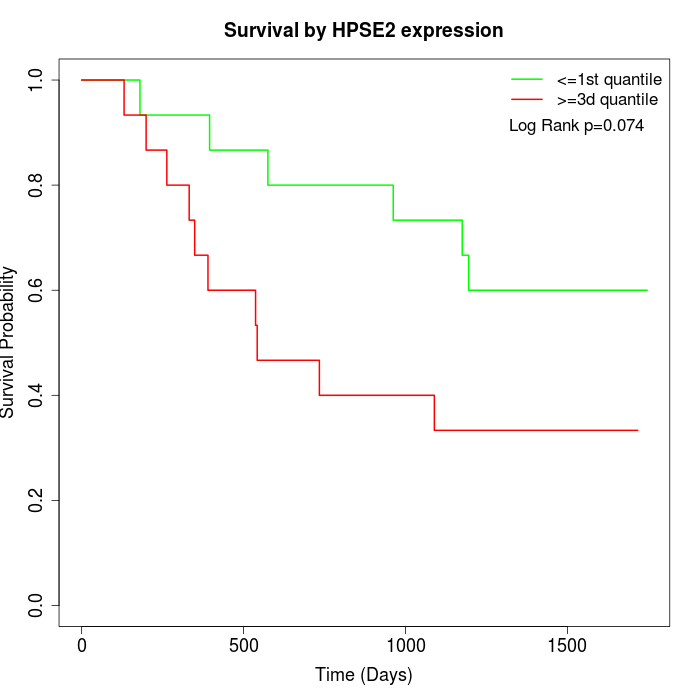 | 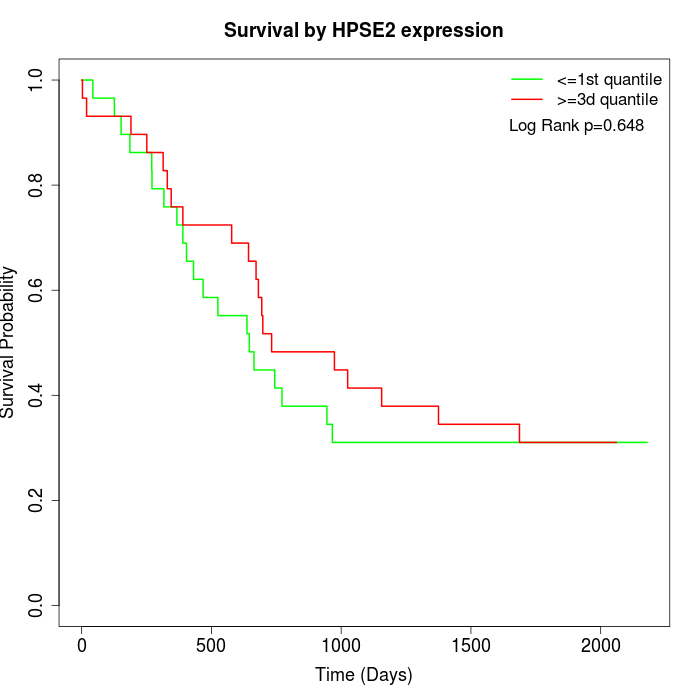 | 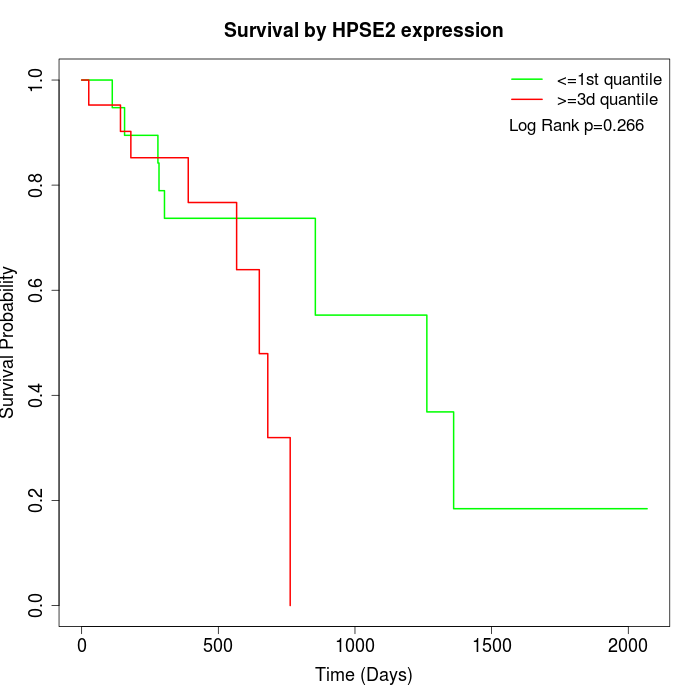 |
| GSE53622 | GSE53624 | TCGA |
Note: Click image to view full size file.
Copy number change of HPSE2:
| Dataset | Gene | EntrezID | Gain | Loss | Normal | Detail |
|---|---|---|---|---|---|---|
| GSE15526 | HPSE2 | 60495 | 1 | 8 | 21 | |
| GSE20123 | HPSE2 | 60495 | 1 | 7 | 22 | |
| GSE43470 | HPSE2 | 60495 | 0 | 7 | 36 | |
| GSE46452 | HPSE2 | 60495 | 0 | 11 | 48 | |
| GSE47630 | HPSE2 | 60495 | 2 | 14 | 24 | |
| GSE54993 | HPSE2 | 60495 | 8 | 0 | 62 | |
| GSE54994 | HPSE2 | 60495 | 1 | 12 | 40 | |
| GSE60625 | HPSE2 | 60495 | 0 | 0 | 11 | |
| GSE74703 | HPSE2 | 60495 | 0 | 5 | 31 | |
| GSE74704 | HPSE2 | 60495 | 0 | 4 | 16 | |
| TCGA | HPSE2 | 60495 | 5 | 28 | 63 |
Total number of gains: 18; Total number of losses: 96; Total Number of normals: 374.
Somatic mutations of HPSE2:
Generating mutation plots.
Highly correlated genes for HPSE2:
Showing top 20/1160 corelated genes with mean PCC>0.5.
| Gene1 | Gene2 | Mean PCC | Num. Datasets | Num. PCC<0 | Num. PCC>0.5 |
|---|---|---|---|---|---|
| HPSE2 | SORCS1 | 0.895664 | 4 | 0 | 4 |
| HPSE2 | RAB9B | 0.867517 | 5 | 0 | 5 |
| HPSE2 | RBPMS2 | 0.857693 | 5 | 0 | 5 |
| HPSE2 | SLMAP | 0.850914 | 5 | 0 | 5 |
| HPSE2 | XKR4 | 0.845787 | 5 | 0 | 5 |
| HPSE2 | CLEC3B | 0.840167 | 3 | 0 | 3 |
| HPSE2 | PYGM | 0.817985 | 9 | 0 | 9 |
| HPSE2 | SGCA | 0.806588 | 9 | 0 | 9 |
| HPSE2 | ANO5 | 0.804324 | 5 | 0 | 5 |
| HPSE2 | LONRF2 | 0.803842 | 5 | 0 | 5 |
| HPSE2 | PPP1R12B | 0.803799 | 8 | 0 | 8 |
| HPSE2 | LRFN5 | 0.800107 | 4 | 0 | 4 |
| HPSE2 | VMAC | 0.780701 | 3 | 0 | 3 |
| HPSE2 | ANGPTL1 | 0.780366 | 6 | 0 | 5 |
| HPSE2 | HSPB7 | 0.777947 | 9 | 0 | 9 |
| HPSE2 | PI16 | 0.775285 | 5 | 0 | 4 |
| HPSE2 | CACNB2 | 0.774516 | 9 | 0 | 8 |
| HPSE2 | PTCHD1 | 0.772988 | 5 | 0 | 5 |
| HPSE2 | TMOD1 | 0.771633 | 6 | 0 | 6 |
| HPSE2 | PDE1C | 0.767272 | 8 | 0 | 7 |
For details and further investigation, click here