| Full name: RRAD and GEM like GTPase 1 | Alias Symbol: GES | ||
| Type: protein-coding gene | Cytoband: 20q11.21 | ||
| Entrez ID: 28954 | HGNC ID: HGNC:15922 | Ensembl Gene: ENSG00000088320 | OMIM ID: 610388 |
Expression of REM1:
| Dataset | Gene | EntrezID | Probe | Log2FC | Adj.pValue | Expression |
|---|---|---|---|---|---|---|
| GSE17351 | REM1 | 28954 | 210300_at | 0.0376 | 0.9307 | |
| GSE20347 | REM1 | 28954 | 210300_at | -0.0548 | 0.5365 | |
| GSE23400 | REM1 | 28954 | 210300_at | -0.2567 | 0.0000 | |
| GSE26886 | REM1 | 28954 | 210300_at | -0.1622 | 0.3218 | |
| GSE29001 | REM1 | 28954 | 210300_at | -0.0951 | 0.6295 | |
| GSE38129 | REM1 | 28954 | 210300_at | -0.2535 | 0.0078 | |
| GSE45670 | REM1 | 28954 | 210300_at | -0.2105 | 0.0467 | |
| GSE53622 | REM1 | 28954 | 10268 | -0.3552 | 0.0000 | |
| GSE53624 | REM1 | 28954 | 10268 | 0.0365 | 0.6860 | |
| GSE63941 | REM1 | 28954 | 210300_at | 0.2231 | 0.2670 | |
| GSE77861 | REM1 | 28954 | 210300_at | -0.0565 | 0.6157 | |
| GSE97050 | REM1 | 28954 | A_23_P28948 | -0.2346 | 0.5036 | |
| SRP133303 | REM1 | 28954 | RNAseq | -0.6084 | 0.0912 | |
| SRP219564 | REM1 | 28954 | RNAseq | 0.3167 | 0.7175 | |
| TCGA | REM1 | 28954 | RNAseq | -0.3348 | 0.2433 |
Upregulated datasets: 0; Downregulated datasets: 0.
Survival by REM1 expression:
 | 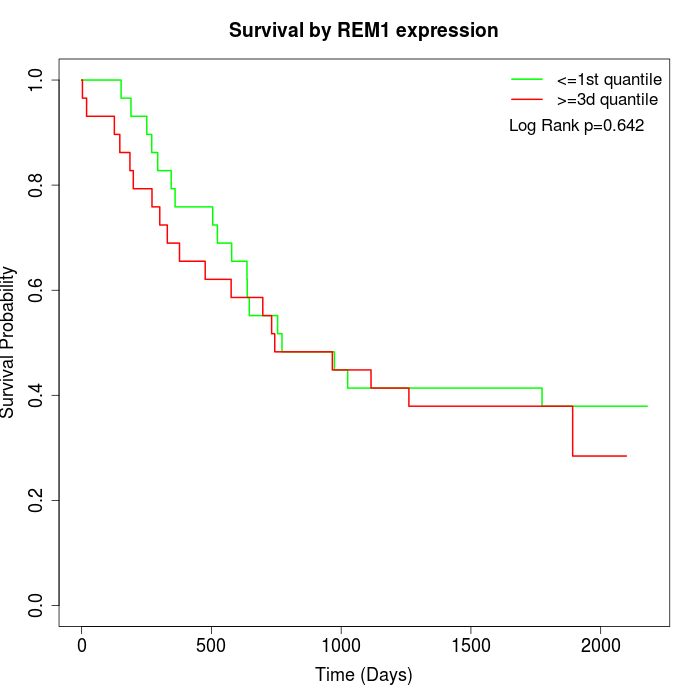 | 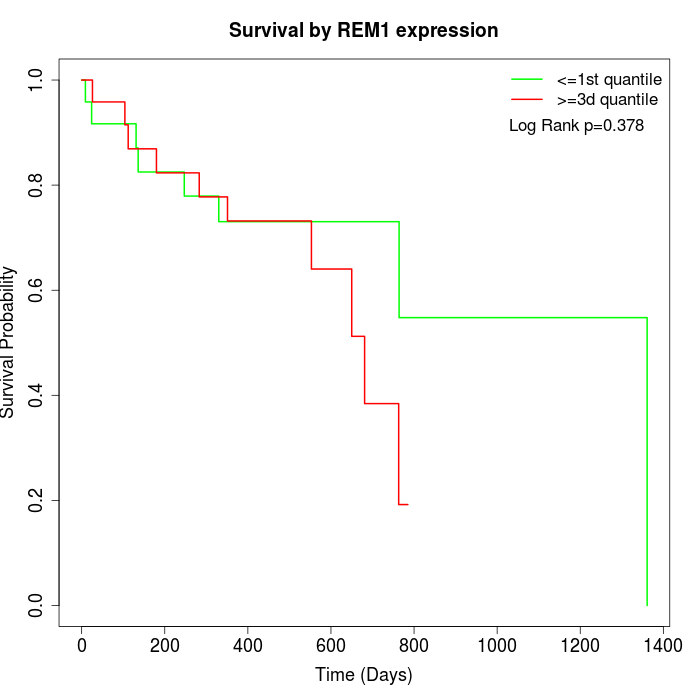 |
| GSE53622 | GSE53624 | TCGA |
Note: Click image to view full size file.
Copy number change of REM1:
| Dataset | Gene | EntrezID | Gain | Loss | Normal | Detail |
|---|---|---|---|---|---|---|
| GSE15526 | REM1 | 28954 | 14 | 0 | 16 | |
| GSE20123 | REM1 | 28954 | 14 | 0 | 16 | |
| GSE43470 | REM1 | 28954 | 11 | 0 | 32 | |
| GSE46452 | REM1 | 28954 | 29 | 0 | 30 | |
| GSE47630 | REM1 | 28954 | 24 | 0 | 16 | |
| GSE54993 | REM1 | 28954 | 0 | 17 | 53 | |
| GSE54994 | REM1 | 28954 | 27 | 1 | 25 | |
| GSE60625 | REM1 | 28954 | 0 | 0 | 11 | |
| GSE74703 | REM1 | 28954 | 10 | 0 | 26 | |
| GSE74704 | REM1 | 28954 | 9 | 0 | 11 | |
| TCGA | REM1 | 28954 | 49 | 1 | 46 |
Total number of gains: 187; Total number of losses: 19; Total Number of normals: 282.
Somatic mutations of REM1:
Generating mutation plots.
Highly correlated genes for REM1:
Showing top 20/609 corelated genes with mean PCC>0.5.
| Gene1 | Gene2 | Mean PCC | Num. Datasets | Num. PCC<0 | Num. PCC>0.5 |
|---|---|---|---|---|---|
| REM1 | METRN | 0.701348 | 3 | 0 | 3 |
| REM1 | WFDC3 | 0.686231 | 3 | 0 | 3 |
| REM1 | MUC13 | 0.685469 | 4 | 0 | 4 |
| REM1 | NOS2 | 0.677673 | 4 | 0 | 4 |
| REM1 | CRTC1 | 0.672556 | 6 | 0 | 6 |
| REM1 | TERT | 0.672524 | 4 | 0 | 4 |
| REM1 | CDH23 | 0.669171 | 4 | 0 | 3 |
| REM1 | ADRA2C | 0.664142 | 3 | 0 | 3 |
| REM1 | ARC | 0.663705 | 3 | 0 | 3 |
| REM1 | NACAD | 0.66097 | 7 | 0 | 6 |
| REM1 | AMT | 0.657841 | 6 | 0 | 5 |
| REM1 | CACNA1H | 0.657753 | 7 | 0 | 6 |
| REM1 | GPR26 | 0.657484 | 4 | 0 | 4 |
| REM1 | ELAVL3 | 0.656704 | 4 | 0 | 3 |
| REM1 | SLN | 0.656462 | 4 | 0 | 3 |
| REM1 | PPP1R12C | 0.652252 | 4 | 0 | 4 |
| REM1 | IGFALS | 0.649861 | 4 | 0 | 3 |
| REM1 | ZNF483 | 0.648117 | 4 | 0 | 3 |
| REM1 | TOM1L2 | 0.646102 | 3 | 0 | 3 |
| REM1 | CASR | 0.644796 | 4 | 0 | 3 |
For details and further investigation, click here