| Full name: splicing factor 1 | Alias Symbol: ZFM1|ZCCHC25 | ||
| Type: protein-coding gene | Cytoband: 11q13.1 | ||
| Entrez ID: 7536 | HGNC ID: HGNC:12950 | Ensembl Gene: ENSG00000168066 | OMIM ID: 601516 |
Screen Evidence:
| |||
Expression of SF1:
| Dataset | Gene | EntrezID | Probe | Log2FC | Adj.pValue | Expression |
|---|---|---|---|---|---|---|
| GSE17351 | SF1 | 7536 | 208313_s_at | 0.2475 | 0.4429 | |
| GSE20347 | SF1 | 7536 | 208313_s_at | 0.3061 | 0.0028 | |
| GSE23400 | SF1 | 7536 | 208313_s_at | 0.3575 | 0.0000 | |
| GSE26886 | SF1 | 7536 | 208313_s_at | -0.0213 | 0.9322 | |
| GSE29001 | SF1 | 7536 | 208313_s_at | 0.1095 | 0.8083 | |
| GSE38129 | SF1 | 7536 | 208313_s_at | 0.2128 | 0.0331 | |
| GSE45670 | SF1 | 7536 | 208313_s_at | 0.1293 | 0.1592 | |
| GSE53622 | SF1 | 7536 | 30024 | 0.2360 | 0.0000 | |
| GSE53624 | SF1 | 7536 | 86747 | 0.3280 | 0.0000 | |
| GSE63941 | SF1 | 7536 | 208313_s_at | -0.0793 | 0.7793 | |
| GSE77861 | SF1 | 7536 | 208313_s_at | 0.4513 | 0.0018 | |
| GSE97050 | SF1 | 7536 | A_24_P266728 | 0.0462 | 0.8439 | |
| SRP007169 | SF1 | 7536 | RNAseq | 1.2395 | 0.0065 | |
| SRP008496 | SF1 | 7536 | RNAseq | 0.8288 | 0.0126 | |
| SRP064894 | SF1 | 7536 | RNAseq | 0.0391 | 0.7268 | |
| SRP133303 | SF1 | 7536 | RNAseq | 0.1193 | 0.4297 | |
| SRP159526 | SF1 | 7536 | RNAseq | 0.0669 | 0.7772 | |
| SRP193095 | SF1 | 7536 | RNAseq | 0.2911 | 0.0075 | |
| SRP219564 | SF1 | 7536 | RNAseq | -0.1416 | 0.6197 | |
| TCGA | SF1 | 7536 | RNAseq | -0.0187 | 0.6271 |
Upregulated datasets: 1; Downregulated datasets: 0.
Survival by SF1 expression:
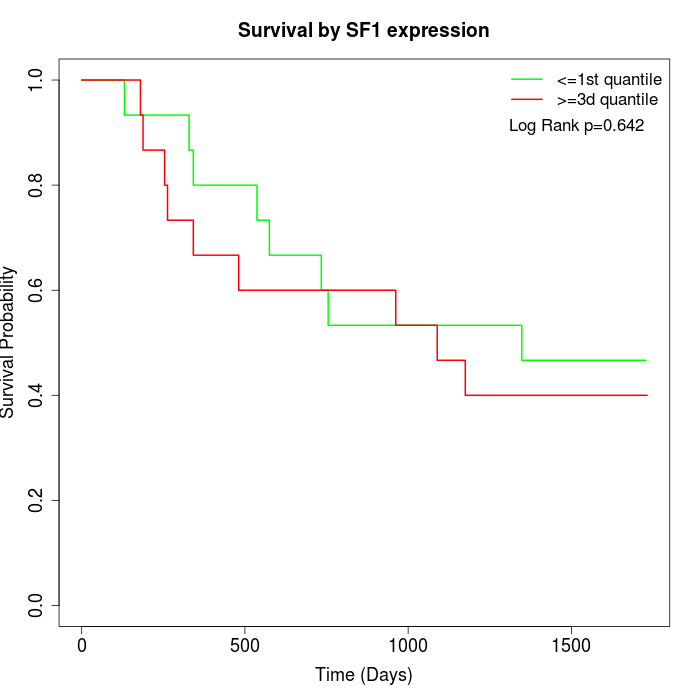 | 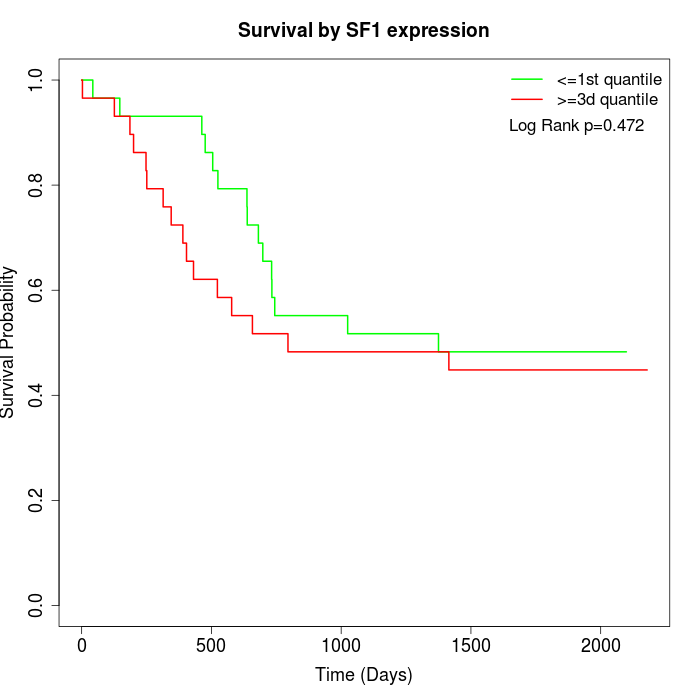 | 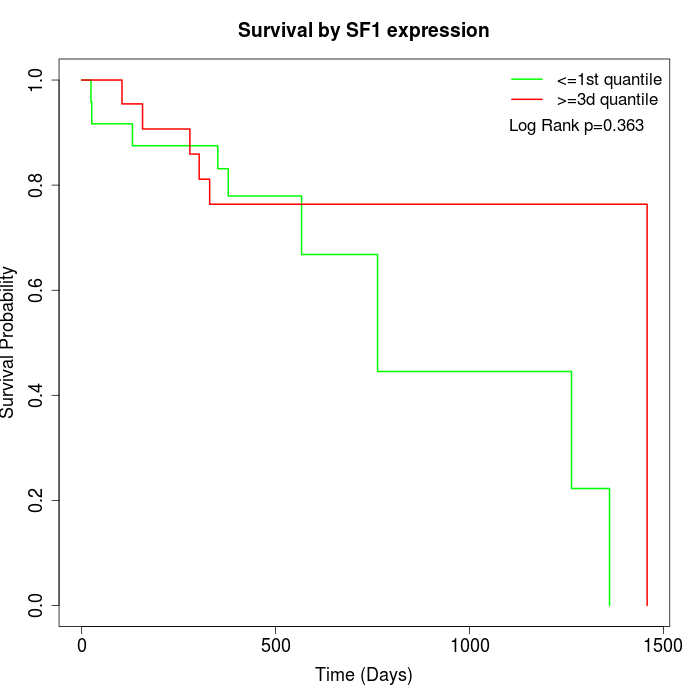 |
| GSE53622 | GSE53624 | TCGA |
Note: Click image to view full size file.
Copy number change of SF1:
| Dataset | Gene | EntrezID | Gain | Loss | Normal | Detail |
|---|---|---|---|---|---|---|
| GSE15526 | SF1 | 7536 | 7 | 6 | 17 | |
| GSE20123 | SF1 | 7536 | 7 | 6 | 17 | |
| GSE43470 | SF1 | 7536 | 1 | 3 | 39 | |
| GSE46452 | SF1 | 7536 | 9 | 4 | 46 | |
| GSE47630 | SF1 | 7536 | 5 | 6 | 29 | |
| GSE54993 | SF1 | 7536 | 3 | 1 | 66 | |
| GSE54994 | SF1 | 7536 | 6 | 5 | 42 | |
| GSE60625 | SF1 | 7536 | 0 | 3 | 8 | |
| GSE74703 | SF1 | 7536 | 1 | 1 | 34 | |
| GSE74704 | SF1 | 7536 | 5 | 4 | 11 | |
| TCGA | SF1 | 7536 | 20 | 8 | 68 |
Total number of gains: 64; Total number of losses: 47; Total Number of normals: 377.
Somatic mutations of SF1:
Generating mutation plots.
Highly correlated genes for SF1:
Showing top 20/953 corelated genes with mean PCC>0.5.
| Gene1 | Gene2 | Mean PCC | Num. Datasets | Num. PCC<0 | Num. PCC>0.5 |
|---|---|---|---|---|---|
| SF1 | CRTC2 | 0.854246 | 3 | 0 | 3 |
| SF1 | CCNT1 | 0.837907 | 3 | 0 | 3 |
| SF1 | SSBP4 | 0.806248 | 3 | 0 | 3 |
| SF1 | RAVER1 | 0.789792 | 3 | 0 | 3 |
| SF1 | ARFGAP2 | 0.783043 | 3 | 0 | 3 |
| SF1 | SLC25A28 | 0.774042 | 3 | 0 | 3 |
| SF1 | EXOC6 | 0.770406 | 3 | 0 | 3 |
| SF1 | NACC1 | 0.765733 | 3 | 0 | 3 |
| SF1 | SLC39A3 | 0.762949 | 3 | 0 | 3 |
| SF1 | RILPL1 | 0.754205 | 3 | 0 | 3 |
| SF1 | SOX13 | 0.753394 | 3 | 0 | 3 |
| SF1 | ZNF322 | 0.753228 | 3 | 0 | 3 |
| SF1 | RAB8A | 0.745525 | 3 | 0 | 3 |
| SF1 | CCDC124 | 0.743639 | 3 | 0 | 3 |
| SF1 | INTS9 | 0.738842 | 3 | 0 | 3 |
| SF1 | TXNL4A | 0.736249 | 4 | 0 | 4 |
| SF1 | ZFYVE27 | 0.732886 | 3 | 0 | 3 |
| SF1 | MPPED2 | 0.729144 | 3 | 0 | 3 |
| SF1 | LENG8 | 0.727902 | 3 | 0 | 3 |
| SF1 | GGNBP2 | 0.727711 | 4 | 0 | 3 |
For details and further investigation, click here