| Full name: solute carrier family 29 member 3 | Alias Symbol: ENT3|FLJ11160 | ||
| Type: protein-coding gene | Cytoband: 10q22.1 | ||
| Entrez ID: 55315 | HGNC ID: HGNC:23096 | Ensembl Gene: ENSG00000198246 | OMIM ID: 612373 |
| Drug and gene relationship at DGIdb | |||
Screen Evidence:
| |||
Expression of SLC29A3:
| Dataset | Gene | EntrezID | Probe | Log2FC | Adj.pValue | Expression |
|---|---|---|---|---|---|---|
| GSE17351 | SLC29A3 | 55315 | 219344_at | 0.2590 | 0.5213 | |
| GSE20347 | SLC29A3 | 55315 | 219344_at | 0.1853 | 0.0579 | |
| GSE23400 | SLC29A3 | 55315 | 219344_at | -0.1320 | 0.0021 | |
| GSE26886 | SLC29A3 | 55315 | 219344_at | 0.3358 | 0.0263 | |
| GSE29001 | SLC29A3 | 55315 | 219344_at | -0.1539 | 0.3296 | |
| GSE38129 | SLC29A3 | 55315 | 219344_at | 0.1317 | 0.1602 | |
| GSE45670 | SLC29A3 | 55315 | 219344_at | -0.0192 | 0.8870 | |
| GSE53622 | SLC29A3 | 55315 | 47865 | 0.6658 | 0.0000 | |
| GSE53624 | SLC29A3 | 55315 | 47865 | 0.6248 | 0.0000 | |
| GSE63941 | SLC29A3 | 55315 | 219344_at | 0.2513 | 0.7383 | |
| GSE77861 | SLC29A3 | 55315 | 219344_at | -0.1366 | 0.2756 | |
| GSE97050 | SLC29A3 | 55315 | A_23_P46871 | 0.5484 | 0.1403 | |
| SRP007169 | SLC29A3 | 55315 | RNAseq | 0.4723 | 0.5732 | |
| SRP064894 | SLC29A3 | 55315 | RNAseq | 1.2218 | 0.0009 | |
| SRP133303 | SLC29A3 | 55315 | RNAseq | 0.8079 | 0.0005 | |
| SRP159526 | SLC29A3 | 55315 | RNAseq | 0.7288 | 0.0647 | |
| SRP193095 | SLC29A3 | 55315 | RNAseq | 0.4567 | 0.0400 | |
| SRP219564 | SLC29A3 | 55315 | RNAseq | 0.6856 | 0.1147 | |
| TCGA | SLC29A3 | 55315 | RNAseq | -0.1922 | 0.0687 |
Upregulated datasets: 1; Downregulated datasets: 0.
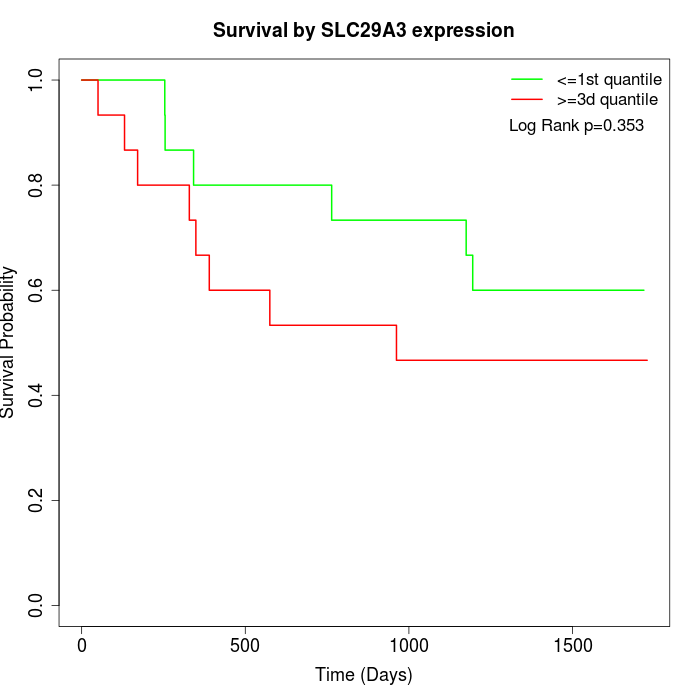
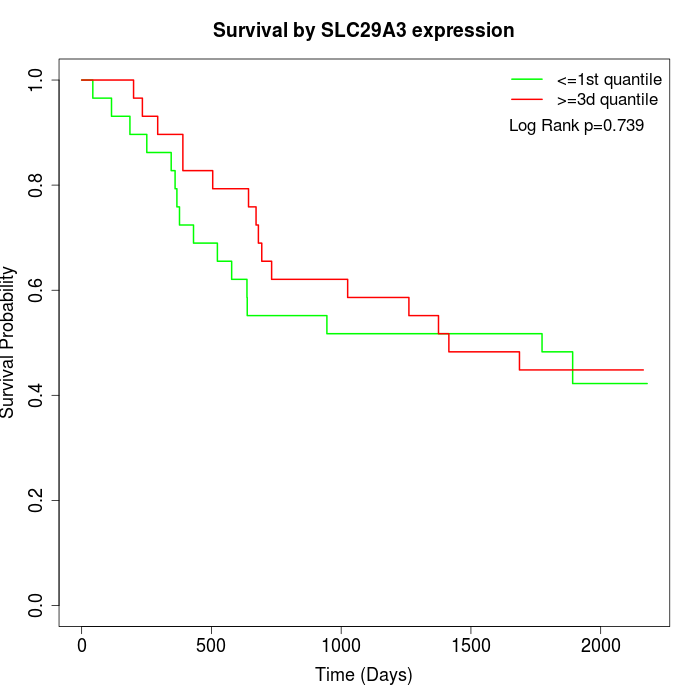
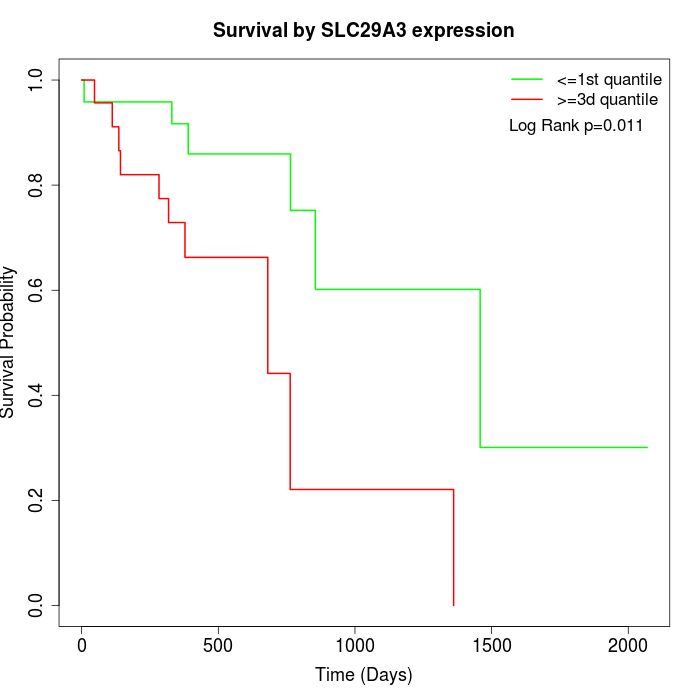
Survival by SLC29A3 expression:
Note: Click image to view full size file.
Copy number change of SLC29A3:
| Dataset | Gene | EntrezID | Gain | Loss | Normal | Detail |
|---|---|---|---|---|---|---|
| GSE15526 | SLC29A3 | 55315 | 2 | 4 | 24 | |
| GSE20123 | SLC29A3 | 55315 | 2 | 3 | 25 | |
| GSE43470 | SLC29A3 | 55315 | 1 | 8 | 34 | |
| GSE46452 | SLC29A3 | 55315 | 0 | 11 | 48 | |
| GSE47630 | SLC29A3 | 55315 | 2 | 14 | 24 | |
| GSE54993 | SLC29A3 | 55315 | 7 | 0 | 63 | |
| GSE54994 | SLC29A3 | 55315 | 2 | 11 | 40 | |
| GSE60625 | SLC29A3 | 55315 | 0 | 0 | 11 | |
| GSE74703 | SLC29A3 | 55315 | 1 | 5 | 30 | |
| GSE74704 | SLC29A3 | 55315 | 1 | 1 | 18 | |
| TCGA | SLC29A3 | 55315 | 11 | 23 | 62 |
Total number of gains: 29; Total number of losses: 80; Total Number of normals: 379.
Somatic mutations of SLC29A3:
Generating mutation plots.
Highly correlated genes for SLC29A3:
Showing top 20/456 corelated genes with mean PCC>0.5.
| Gene1 | Gene2 | Mean PCC | Num. Datasets | Num. PCC<0 | Num. PCC>0.5 |
|---|---|---|---|---|---|
| SLC29A3 | TBCC | 0.801973 | 3 | 0 | 3 |
| SLC29A3 | ZNRD1 | 0.796444 | 3 | 0 | 3 |
| SLC29A3 | ZNF287 | 0.79001 | 3 | 0 | 3 |
| SLC29A3 | SSBP4 | 0.785245 | 3 | 0 | 3 |
| SLC29A3 | SLC15A3 | 0.770579 | 3 | 0 | 3 |
| SLC29A3 | CRTC2 | 0.768937 | 3 | 0 | 3 |
| SLC29A3 | HSPBP1 | 0.762681 | 3 | 0 | 3 |
| SLC29A3 | ERP27 | 0.748556 | 3 | 0 | 3 |
| SLC29A3 | NSD1 | 0.74077 | 3 | 0 | 3 |
| SLC29A3 | GLIS3 | 0.727574 | 4 | 0 | 3 |
| SLC29A3 | UBASH3A | 0.722346 | 3 | 0 | 3 |
| SLC29A3 | YIPF3 | 0.714857 | 4 | 0 | 3 |
| SLC29A3 | PLCD3 | 0.713522 | 3 | 0 | 3 |
| SLC29A3 | ZNF789 | 0.713349 | 3 | 0 | 3 |
| SLC29A3 | WDTC1 | 0.713104 | 4 | 0 | 4 |
| SLC29A3 | POC5 | 0.712837 | 3 | 0 | 3 |
| SLC29A3 | TTLL1 | 0.71278 | 3 | 0 | 3 |
| SLC29A3 | TMTC4 | 0.712153 | 3 | 0 | 3 |
| SLC29A3 | GNG3 | 0.711359 | 3 | 0 | 3 |
| SLC29A3 | LCP2 | 0.709389 | 3 | 0 | 3 |
For details and further investigation, click here


