| Full name: solute carrier family 35 member C1 | Alias Symbol: FUCT1|FLJ11320 | ||
| Type: protein-coding gene | Cytoband: 11p11.2 | ||
| Entrez ID: 55343 | HGNC ID: HGNC:20197 | Ensembl Gene: ENSG00000181830 | OMIM ID: 605881 |
Expression of SLC35C1:
| Dataset | Gene | EntrezID | Probe | Log2FC | Adj.pValue | Expression |
|---|---|---|---|---|---|---|
| GSE17351 | SLC35C1 | 55343 | 222647_at | -1.1302 | 0.0571 | |
| GSE20347 | SLC35C1 | 55343 | 218485_s_at | -1.2365 | 0.0000 | |
| GSE23400 | SLC35C1 | 55343 | 218485_s_at | -0.9069 | 0.0000 | |
| GSE26886 | SLC35C1 | 55343 | 222647_at | -1.4393 | 0.0000 | |
| GSE29001 | SLC35C1 | 55343 | 218485_s_at | -1.1616 | 0.0001 | |
| GSE38129 | SLC35C1 | 55343 | 218485_s_at | -0.9974 | 0.0000 | |
| GSE45670 | SLC35C1 | 55343 | 218485_s_at | -0.4615 | 0.0390 | |
| GSE53622 | SLC35C1 | 55343 | 6185 | -1.3994 | 0.0000 | |
| GSE53624 | SLC35C1 | 55343 | 6185 | -1.5873 | 0.0000 | |
| GSE63941 | SLC35C1 | 55343 | 222647_at | -0.4300 | 0.3039 | |
| GSE77861 | SLC35C1 | 55343 | 222647_at | -0.9293 | 0.0024 | |
| GSE97050 | SLC35C1 | 55343 | A_23_P202720 | -0.1356 | 0.6935 | |
| SRP007169 | SLC35C1 | 55343 | RNAseq | -3.4740 | 0.0000 | |
| SRP008496 | SLC35C1 | 55343 | RNAseq | -3.2318 | 0.0000 | |
| SRP064894 | SLC35C1 | 55343 | RNAseq | -1.9505 | 0.0000 | |
| SRP133303 | SLC35C1 | 55343 | RNAseq | -1.0919 | 0.0003 | |
| SRP159526 | SLC35C1 | 55343 | RNAseq | -2.5259 | 0.0000 | |
| SRP193095 | SLC35C1 | 55343 | RNAseq | -1.7954 | 0.0000 | |
| SRP219564 | SLC35C1 | 55343 | RNAseq | -1.7737 | 0.0022 | |
| TCGA | SLC35C1 | 55343 | RNAseq | -0.1634 | 0.0101 |
Upregulated datasets: 0; Downregulated datasets: 12.
Survival by SLC35C1 expression:
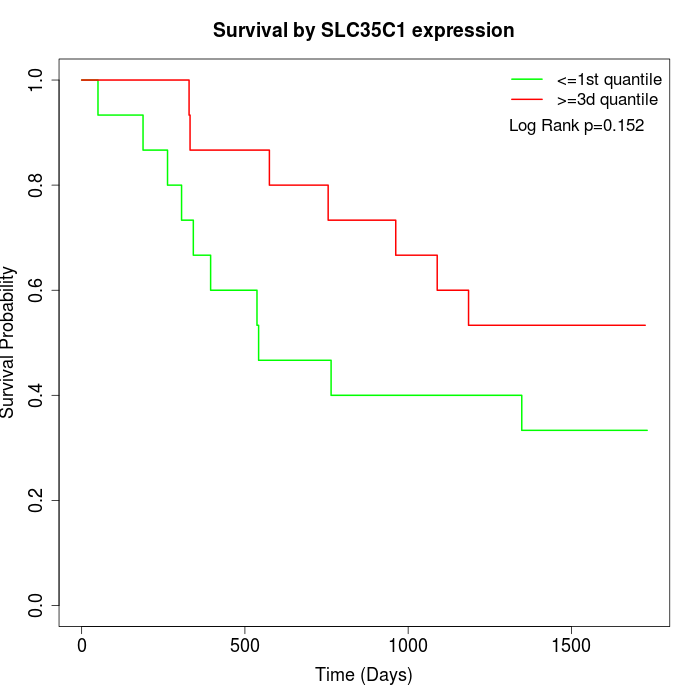 | 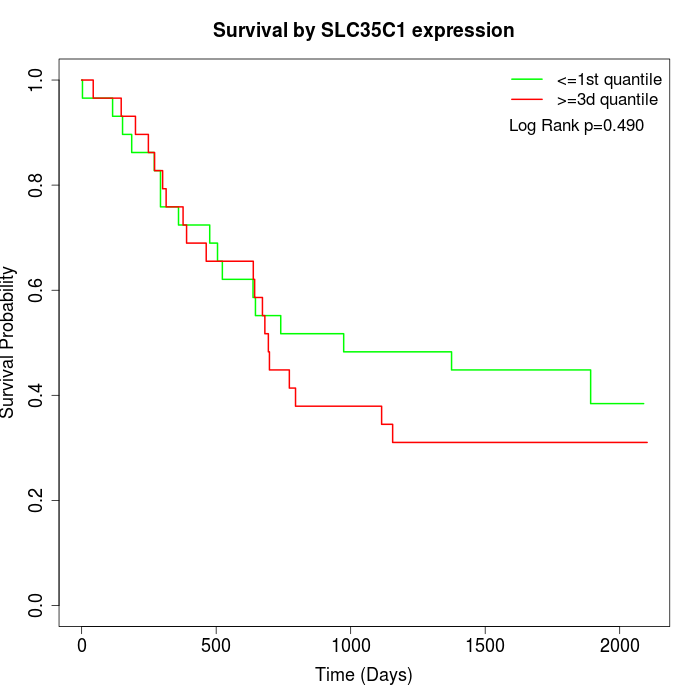 | 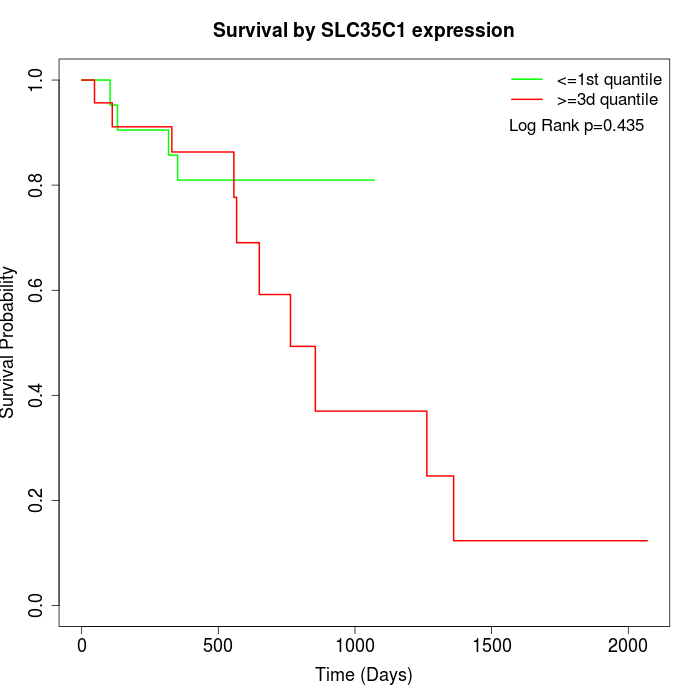 |
| GSE53622 | GSE53624 | TCGA |
Note: Click image to view full size file.
Copy number change of SLC35C1:
| Dataset | Gene | EntrezID | Gain | Loss | Normal | Detail |
|---|---|---|---|---|---|---|
| GSE15526 | SLC35C1 | 55343 | 3 | 7 | 20 | |
| GSE20123 | SLC35C1 | 55343 | 2 | 6 | 22 | |
| GSE43470 | SLC35C1 | 55343 | 2 | 4 | 37 | |
| GSE46452 | SLC35C1 | 55343 | 8 | 5 | 46 | |
| GSE47630 | SLC35C1 | 55343 | 3 | 9 | 28 | |
| GSE54993 | SLC35C1 | 55343 | 3 | 0 | 67 | |
| GSE54994 | SLC35C1 | 55343 | 3 | 9 | 41 | |
| GSE60625 | SLC35C1 | 55343 | 0 | 0 | 11 | |
| GSE74703 | SLC35C1 | 55343 | 2 | 2 | 32 | |
| GSE74704 | SLC35C1 | 55343 | 1 | 4 | 15 | |
| TCGA | SLC35C1 | 55343 | 17 | 18 | 61 |
Total number of gains: 44; Total number of losses: 64; Total Number of normals: 380.
Somatic mutations of SLC35C1:
Generating mutation plots.
Highly correlated genes for SLC35C1:
Showing top 20/961 corelated genes with mean PCC>0.5.
| Gene1 | Gene2 | Mean PCC | Num. Datasets | Num. PCC<0 | Num. PCC>0.5 |
|---|---|---|---|---|---|
| SLC35C1 | EPS8L2 | 0.86865 | 11 | 0 | 11 |
| SLC35C1 | MAPK3 | 0.861645 | 10 | 0 | 10 |
| SLC35C1 | TP53I3 | 0.860114 | 10 | 0 | 10 |
| SLC35C1 | FAM3D | 0.858307 | 6 | 0 | 6 |
| SLC35C1 | EPS8L1 | 0.85125 | 10 | 0 | 10 |
| SLC35C1 | PTK6 | 0.844483 | 11 | 0 | 11 |
| SLC35C1 | PADI1 | 0.843988 | 8 | 0 | 8 |
| SLC35C1 | GYS2 | 0.843706 | 10 | 0 | 10 |
| SLC35C1 | TMOD3 | 0.838534 | 10 | 0 | 10 |
| SLC35C1 | EPB41L4A | 0.823933 | 8 | 0 | 8 |
| SLC35C1 | C5orf66-AS1 | 0.823708 | 6 | 0 | 6 |
| SLC35C1 | SNORA68 | 0.823501 | 4 | 0 | 4 |
| SLC35C1 | SPINK7 | 0.82131 | 7 | 0 | 7 |
| SLC35C1 | MALL | 0.819454 | 11 | 0 | 11 |
| SLC35C1 | ECM1 | 0.818328 | 11 | 0 | 11 |
| SLC35C1 | MXD1 | 0.818205 | 11 | 0 | 11 |
| SLC35C1 | GDPD3 | 0.818109 | 11 | 0 | 10 |
| SLC35C1 | RAB10 | 0.817748 | 6 | 0 | 6 |
| SLC35C1 | ZDHHC13 | 0.816775 | 10 | 0 | 10 |
| SLC35C1 | CLIC3 | 0.816033 | 9 | 0 | 8 |
For details and further investigation, click here