| Full name: atlastin GTPase 1 | Alias Symbol: FSP1|AD-FSP | ||
| Type: protein-coding gene | Cytoband: 14q22.1 | ||
| Entrez ID: 51062 | HGNC ID: HGNC:11231 | Ensembl Gene: ENSG00000198513 | OMIM ID: 606439 |
Expression of ATL1:
| Dataset | Gene | EntrezID | Probe | Log2FC | Adj.pValue | Expression |
|---|---|---|---|---|---|---|
| GSE17351 | ATL1 | 51062 | 223340_at | -0.6217 | 0.4620 | |
| GSE26886 | ATL1 | 51062 | 223340_at | -0.6385 | 0.0869 | |
| GSE45670 | ATL1 | 51062 | 223340_at | -0.7123 | 0.0125 | |
| GSE53622 | ATL1 | 51062 | 37853 | -0.5717 | 0.0000 | |
| GSE53624 | ATL1 | 51062 | 37853 | -0.4208 | 0.0001 | |
| GSE63941 | ATL1 | 51062 | 223340_at | -2.8595 | 0.0010 | |
| GSE77861 | ATL1 | 51062 | 223340_at | -0.2612 | 0.5691 | |
| GSE97050 | ATL1 | 51062 | A_23_P88351 | -0.4061 | 0.2893 | |
| SRP007169 | ATL1 | 51062 | RNAseq | -1.0751 | 0.0223 | |
| SRP008496 | ATL1 | 51062 | RNAseq | -0.3361 | 0.3554 | |
| SRP064894 | ATL1 | 51062 | RNAseq | 0.0686 | 0.7353 | |
| SRP133303 | ATL1 | 51062 | RNAseq | -0.4772 | 0.0573 | |
| SRP159526 | ATL1 | 51062 | RNAseq | -0.3219 | 0.4264 | |
| SRP193095 | ATL1 | 51062 | RNAseq | -0.2770 | 0.0985 | |
| SRP219564 | ATL1 | 51062 | RNAseq | -0.2046 | 0.7295 | |
| TCGA | ATL1 | 51062 | RNAseq | -0.3752 | 0.0039 |
Upregulated datasets: 0; Downregulated datasets: 2.
Survival by ATL1 expression:
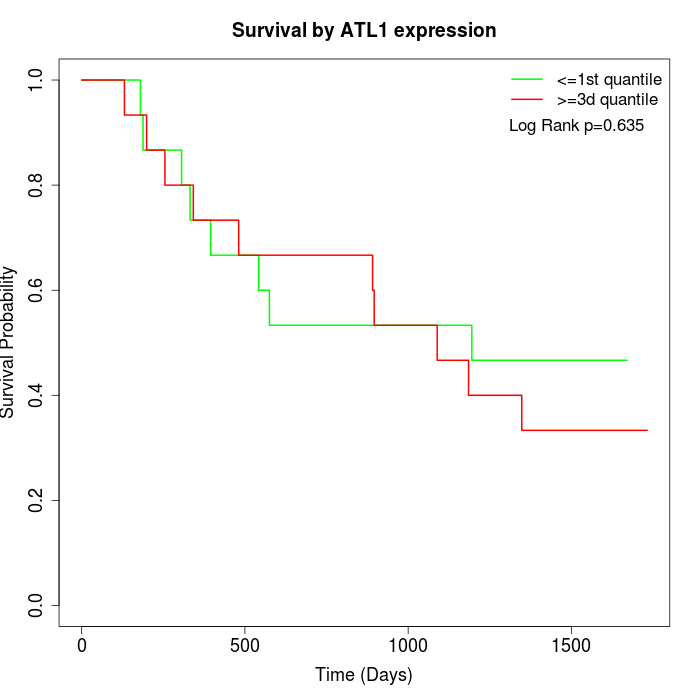 | 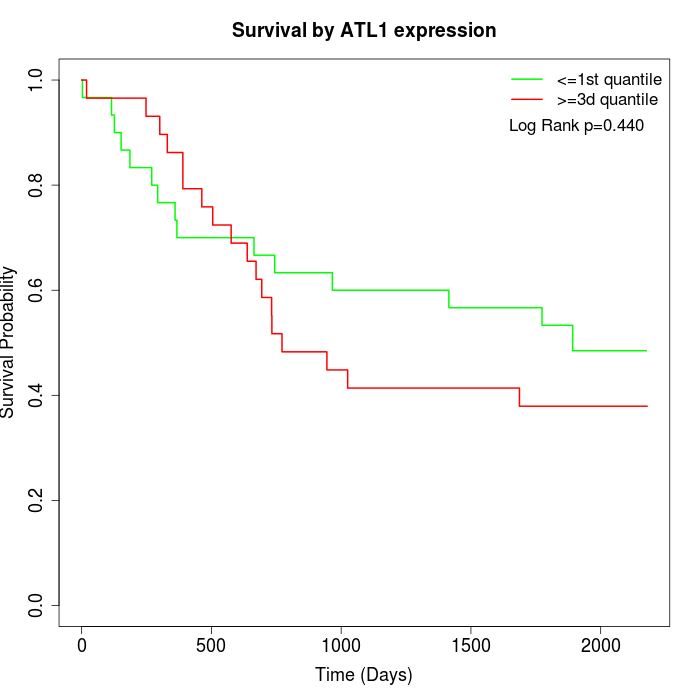 | 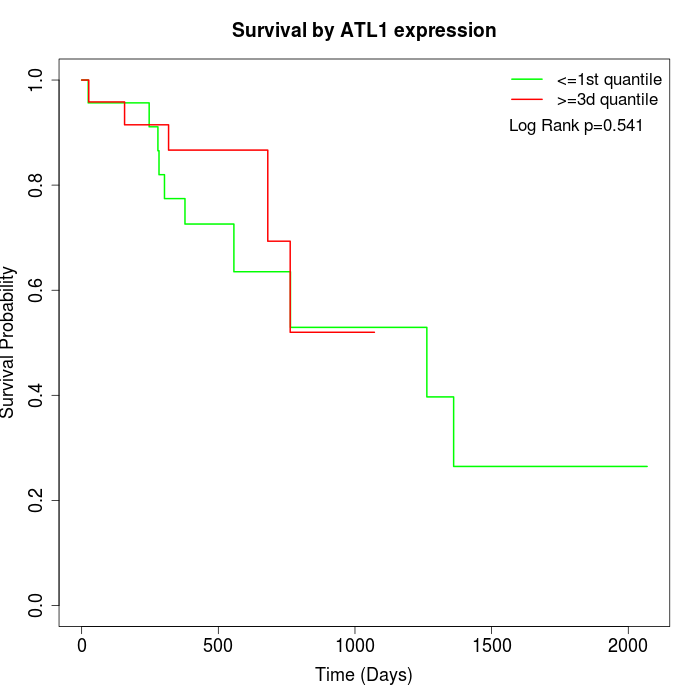 |
| GSE53622 | GSE53624 | TCGA |
Note: Click image to view full size file.
Copy number change of ATL1:
| Dataset | Gene | EntrezID | Gain | Loss | Normal | Detail |
|---|---|---|---|---|---|---|
| GSE15526 | ATL1 | 51062 | 8 | 2 | 20 | |
| GSE20123 | ATL1 | 51062 | 8 | 3 | 19 | |
| GSE43470 | ATL1 | 51062 | 9 | 1 | 33 | |
| GSE46452 | ATL1 | 51062 | 16 | 3 | 40 | |
| GSE47630 | ATL1 | 51062 | 11 | 10 | 19 | |
| GSE54993 | ATL1 | 51062 | 3 | 9 | 58 | |
| GSE54994 | ATL1 | 51062 | 20 | 4 | 29 | |
| GSE60625 | ATL1 | 51062 | 0 | 2 | 9 | |
| GSE74703 | ATL1 | 51062 | 8 | 1 | 27 | |
| GSE74704 | ATL1 | 51062 | 3 | 2 | 15 | |
| TCGA | ATL1 | 51062 | 34 | 13 | 49 |
Total number of gains: 120; Total number of losses: 50; Total Number of normals: 318.
Somatic mutations of ATL1:
Generating mutation plots.
Highly correlated genes for ATL1:
Showing top 20/785 corelated genes with mean PCC>0.5.
| Gene1 | Gene2 | Mean PCC | Num. Datasets | Num. PCC<0 | Num. PCC>0.5 |
|---|---|---|---|---|---|
| ATL1 | RCAN1 | 0.811683 | 3 | 0 | 3 |
| ATL1 | TBC1D19 | 0.802466 | 3 | 0 | 3 |
| ATL1 | CUL1 | 0.79357 | 3 | 0 | 3 |
| ATL1 | PINK1 | 0.790661 | 3 | 0 | 3 |
| ATL1 | SMPD1 | 0.782332 | 3 | 0 | 3 |
| ATL1 | CDIPT | 0.764702 | 3 | 0 | 3 |
| ATL1 | FAM98B | 0.764073 | 3 | 0 | 3 |
| ATL1 | ZNF578 | 0.763922 | 3 | 0 | 3 |
| ATL1 | TIMP3 | 0.762476 | 3 | 0 | 3 |
| ATL1 | RFTN1 | 0.755334 | 3 | 0 | 3 |
| ATL1 | TWSG1 | 0.753378 | 3 | 0 | 3 |
| ATL1 | CDH6 | 0.744581 | 3 | 0 | 3 |
| ATL1 | NFASC | 0.740242 | 4 | 0 | 4 |
| ATL1 | THAP1 | 0.737466 | 3 | 0 | 3 |
| ATL1 | DEXI | 0.733591 | 3 | 0 | 3 |
| ATL1 | MAP4K3 | 0.732029 | 3 | 0 | 3 |
| ATL1 | VCPIP1 | 0.724885 | 3 | 0 | 3 |
| ATL1 | SYNC | 0.723633 | 4 | 0 | 3 |
| ATL1 | RAB23 | 0.721045 | 3 | 0 | 3 |
| ATL1 | KLHL5 | 0.720611 | 3 | 0 | 3 |
For details and further investigation, click here