| Full name: Sp3 transcription factor | Alias Symbol: SPR-2 | ||
| Type: protein-coding gene | Cytoband: 2q31.1 | ||
| Entrez ID: 6670 | HGNC ID: HGNC:11208 | Ensembl Gene: ENSG00000172845 | OMIM ID: 601804 |
| Related drugs: DOXORUBICIN... [more] | |||
Screen Evidence:
| |||
Expression of SP3:
| Dataset | Gene | EntrezID | Probe | Log2FC | Adj.pValue | Expression |
|---|---|---|---|---|---|---|
| GSE17351 | SP3 | 6670 | 213168_at | 0.6446 | 0.0523 | |
| GSE20347 | SP3 | 6670 | 213168_at | 0.4354 | 0.0107 | |
| GSE23400 | SP3 | 6670 | 213168_at | 0.6612 | 0.0000 | |
| GSE26886 | SP3 | 6670 | 213168_at | -0.1184 | 0.4924 | |
| GSE29001 | SP3 | 6670 | 213168_at | 0.3272 | 0.1059 | |
| GSE38129 | SP3 | 6670 | 213168_at | 0.4685 | 0.0003 | |
| GSE45670 | SP3 | 6670 | 213168_at | 0.1189 | 0.3628 | |
| GSE53622 | SP3 | 6670 | 60522 | 0.3644 | 0.0000 | |
| GSE53624 | SP3 | 6670 | 60522 | 0.4506 | 0.0000 | |
| GSE63941 | SP3 | 6670 | 213168_at | -0.1824 | 0.6352 | |
| GSE77861 | SP3 | 6670 | 213168_at | 0.3427 | 0.2499 | |
| GSE97050 | SP3 | 6670 | A_23_P347198 | -0.0195 | 0.9489 | |
| SRP007169 | SP3 | 6670 | RNAseq | 0.1898 | 0.4994 | |
| SRP008496 | SP3 | 6670 | RNAseq | 0.3478 | 0.0312 | |
| SRP064894 | SP3 | 6670 | RNAseq | 0.0694 | 0.7900 | |
| SRP133303 | SP3 | 6670 | RNAseq | 0.3761 | 0.0103 | |
| SRP159526 | SP3 | 6670 | RNAseq | -0.0504 | 0.7542 | |
| SRP193095 | SP3 | 6670 | RNAseq | 0.0186 | 0.8595 | |
| SRP219564 | SP3 | 6670 | RNAseq | 0.3557 | 0.4060 | |
| TCGA | SP3 | 6670 | RNAseq | 0.1610 | 0.0003 |
Upregulated datasets: 0; Downregulated datasets: 0.
Survival by SP3 expression:
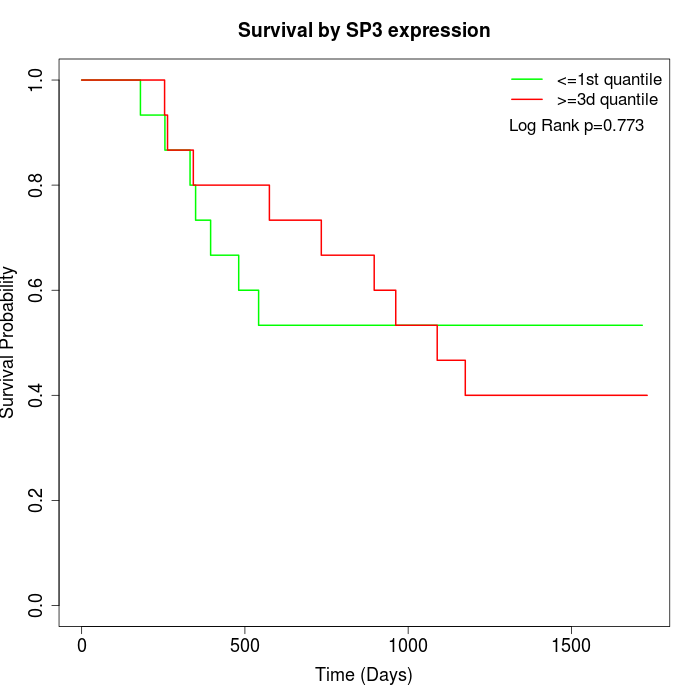 | 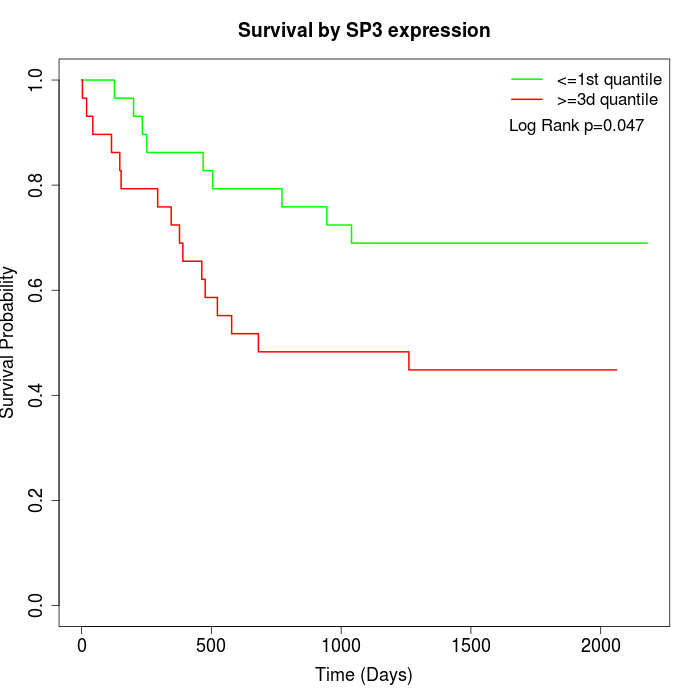 | 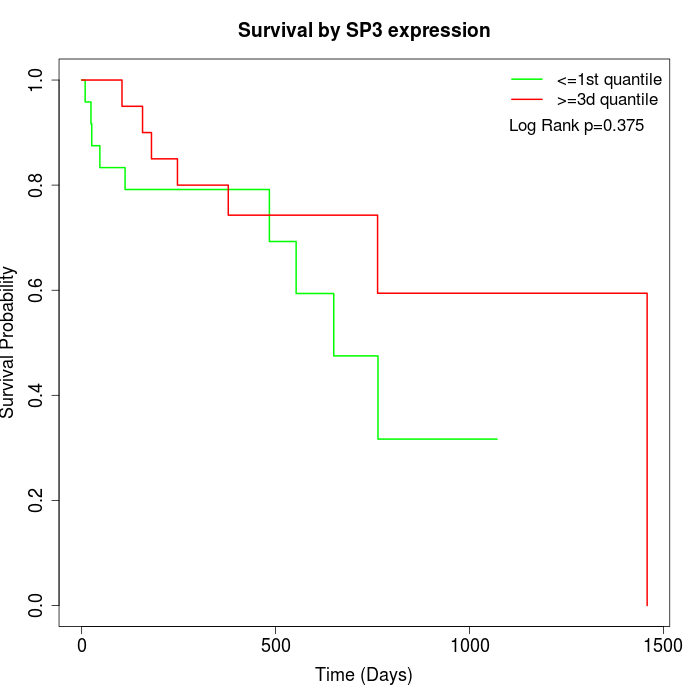 |
| GSE53622 | GSE53624 | TCGA |
Note: Click image to view full size file.
Copy number change of SP3:
| Dataset | Gene | EntrezID | Gain | Loss | Normal | Detail |
|---|---|---|---|---|---|---|
| GSE15526 | SP3 | 6670 | 10 | 0 | 20 | |
| GSE20123 | SP3 | 6670 | 10 | 0 | 20 | |
| GSE43470 | SP3 | 6670 | 8 | 1 | 34 | |
| GSE46452 | SP3 | 6670 | 1 | 4 | 54 | |
| GSE47630 | SP3 | 6670 | 5 | 3 | 32 | |
| GSE54993 | SP3 | 6670 | 0 | 5 | 65 | |
| GSE54994 | SP3 | 6670 | 13 | 3 | 37 | |
| GSE60625 | SP3 | 6670 | 0 | 3 | 8 | |
| GSE74703 | SP3 | 6670 | 6 | 1 | 29 | |
| GSE74704 | SP3 | 6670 | 6 | 0 | 14 | |
| TCGA | SP3 | 6670 | 30 | 5 | 61 |
Total number of gains: 89; Total number of losses: 25; Total Number of normals: 374.
Somatic mutations of SP3:
Generating mutation plots.
Highly correlated genes for SP3:
Showing top 20/961 corelated genes with mean PCC>0.5.
| Gene1 | Gene2 | Mean PCC | Num. Datasets | Num. PCC<0 | Num. PCC>0.5 |
|---|---|---|---|---|---|
| SP3 | RNF4 | 0.815843 | 3 | 0 | 3 |
| SP3 | TMEM18 | 0.782331 | 3 | 0 | 3 |
| SP3 | XXYLT1 | 0.77489 | 3 | 0 | 3 |
| SP3 | GEMIN5 | 0.773968 | 3 | 0 | 3 |
| SP3 | UBQLN4 | 0.770684 | 3 | 0 | 3 |
| SP3 | ALG2 | 0.757541 | 3 | 0 | 3 |
| SP3 | POU2F1 | 0.749661 | 4 | 0 | 4 |
| SP3 | TYW1 | 0.74602 | 3 | 0 | 3 |
| SP3 | RRP36 | 0.742561 | 3 | 0 | 3 |
| SP3 | DGCR8 | 0.738696 | 3 | 0 | 3 |
| SP3 | LDB1 | 0.733867 | 3 | 0 | 3 |
| SP3 | UPF1 | 0.72579 | 3 | 0 | 3 |
| SP3 | NUDT11 | 0.720268 | 5 | 0 | 5 |
| SP3 | HNRNPL | 0.718598 | 3 | 0 | 3 |
| SP3 | B3GALT6 | 0.714457 | 4 | 0 | 4 |
| SP3 | KHSRP | 0.713211 | 3 | 0 | 3 |
| SP3 | LRRC58 | 0.712968 | 4 | 0 | 3 |
| SP3 | AEBP2 | 0.712832 | 4 | 0 | 4 |
| SP3 | ATF2 | 0.710765 | 10 | 0 | 10 |
| SP3 | PIF1 | 0.709317 | 3 | 0 | 3 |
For details and further investigation, click here