| Full name: spermatogenesis associated serine rich 1 | Alias Symbol: SPATA8|FLJ25442|SRSP1 | ||
| Type: protein-coding gene | Cytoband: 6p21.1 | ||
| Entrez ID: 221409 | HGNC ID: HGNC:22957 | Ensembl Gene: ENSG00000249481 | OMIM ID: |
Expression of SPATS1:
| Dataset | Gene | EntrezID | Probe | Log2FC | Adj.pValue | Expression |
|---|---|---|---|---|---|---|
| GSE17351 | SPATS1 | 221409 | 239870_at | -0.0097 | 0.9794 | |
| GSE26886 | SPATS1 | 221409 | 239870_at | -0.1212 | 0.1602 | |
| GSE45670 | SPATS1 | 221409 | 239870_at | 0.0494 | 0.6032 | |
| GSE63941 | SPATS1 | 221409 | 239870_at | 0.2305 | 0.0601 | |
| GSE77861 | SPATS1 | 221409 | 239870_at | -0.2055 | 0.0238 | |
| SRP007169 | SPATS1 | 221409 | RNAseq | 0.8029 | 0.3789 | |
| SRP064894 | SPATS1 | 221409 | RNAseq | -0.6702 | 0.0028 | |
| SRP133303 | SPATS1 | 221409 | RNAseq | 0.0248 | 0.8557 | |
| SRP159526 | SPATS1 | 221409 | RNAseq | -0.9401 | 0.0354 | |
| SRP193095 | SPATS1 | 221409 | RNAseq | 0.0773 | 0.5974 | |
| SRP219564 | SPATS1 | 221409 | RNAseq | -0.7792 | 0.0266 | |
| TCGA | SPATS1 | 221409 | RNAseq | 0.2026 | 0.8523 |
Upregulated datasets: 0; Downregulated datasets: 0.
Survival by SPATS1 expression:
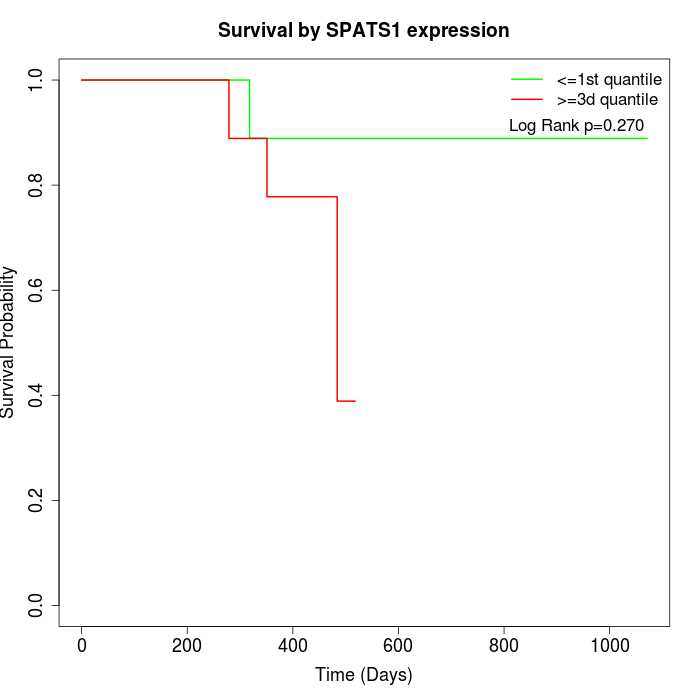 |
| TCGA |
Note: Click image to view full size file.
Copy number change of SPATS1:
| Dataset | Gene | EntrezID | Gain | Loss | Normal | Detail |
|---|---|---|---|---|---|---|
| GSE15526 | SPATS1 | 221409 | 7 | 1 | 22 | |
| GSE20123 | SPATS1 | 221409 | 7 | 1 | 22 | |
| GSE43470 | SPATS1 | 221409 | 6 | 0 | 37 | |
| GSE46452 | SPATS1 | 221409 | 3 | 9 | 47 | |
| GSE47630 | SPATS1 | 221409 | 8 | 4 | 28 | |
| GSE54993 | SPATS1 | 221409 | 3 | 2 | 65 | |
| GSE54994 | SPATS1 | 221409 | 8 | 3 | 42 | |
| GSE60625 | SPATS1 | 221409 | 0 | 3 | 8 | |
| GSE74703 | SPATS1 | 221409 | 6 | 0 | 30 | |
| GSE74704 | SPATS1 | 221409 | 3 | 1 | 16 | |
| TCGA | SPATS1 | 221409 | 21 | 14 | 61 |
Total number of gains: 72; Total number of losses: 38; Total Number of normals: 378.
Somatic mutations of SPATS1:
Generating mutation plots.
Highly correlated genes for SPATS1:
Showing top 20/26 corelated genes with mean PCC>0.5.
| Gene1 | Gene2 | Mean PCC | Num. Datasets | Num. PCC<0 | Num. PCC>0.5 |
|---|---|---|---|---|---|
| SPATS1 | ABCC8 | 0.664836 | 3 | 0 | 3 |
| SPATS1 | C2orf72 | 0.663111 | 3 | 0 | 3 |
| SPATS1 | CHRNA6 | 0.658793 | 3 | 0 | 3 |
| SPATS1 | DEFB118 | 0.611021 | 4 | 0 | 3 |
| SPATS1 | HAAO | 0.599308 | 4 | 0 | 4 |
| SPATS1 | TSGA13 | 0.596489 | 4 | 0 | 3 |
| SPATS1 | C2orf16 | 0.592118 | 3 | 0 | 3 |
| SPATS1 | HHIP | 0.576095 | 3 | 0 | 3 |
| SPATS1 | TECR | 0.572941 | 3 | 0 | 3 |
| SPATS1 | TREML2 | 0.571637 | 3 | 0 | 3 |
| SPATS1 | LINC01085 | 0.562437 | 3 | 0 | 3 |
| SPATS1 | WNT16 | 0.556565 | 4 | 0 | 3 |
| SPATS1 | RAB4B | 0.555633 | 4 | 0 | 3 |
| SPATS1 | LYPD8 | 0.551562 | 5 | 0 | 3 |
| SPATS1 | NLRP8 | 0.550834 | 5 | 0 | 4 |
| SPATS1 | GPR82 | 0.549808 | 3 | 0 | 3 |
| SPATS1 | LINC01343 | 0.542959 | 4 | 0 | 3 |
| SPATS1 | SIRT3 | 0.541622 | 4 | 0 | 3 |
| SPATS1 | MYO1A | 0.538808 | 3 | 0 | 3 |
| SPATS1 | OR4D2 | 0.537566 | 5 | 0 | 3 |
For details and further investigation, click here