| Full name: steroid receptor RNA activator 1 | Alias Symbol: SRA|STRAA1 | ||
| Type: protein-coding gene | Cytoband: 5q31.3 | ||
| Entrez ID: 10011 | HGNC ID: HGNC:11281 | Ensembl Gene: ENSG00000213523 | OMIM ID: 603819 |
Expression of SRA1:
| Dataset | Gene | EntrezID | Probe | Log2FC | Adj.pValue | Expression |
|---|---|---|---|---|---|---|
| GSE17351 | SRA1 | 10011 | 224864_at | 0.1497 | 0.7682 | |
| GSE26886 | SRA1 | 10011 | 224864_at | 0.8290 | 0.0004 | |
| GSE45670 | SRA1 | 10011 | 224864_at | 0.1823 | 0.1912 | |
| GSE53622 | SRA1 | 10011 | 10774 | -0.0246 | 0.7217 | |
| GSE53624 | SRA1 | 10011 | 10774 | -0.0787 | 0.2239 | |
| GSE63941 | SRA1 | 10011 | 224864_at | -0.2896 | 0.5682 | |
| GSE77861 | SRA1 | 10011 | 224864_at | -0.0325 | 0.9321 | |
| GSE97050 | SRA1 | 10011 | A_23_P257578 | 0.1394 | 0.6013 | |
| SRP007169 | SRA1 | 10011 | RNAseq | -0.6996 | 0.1620 | |
| SRP008496 | SRA1 | 10011 | RNAseq | -0.7593 | 0.0198 | |
| SRP064894 | SRA1 | 10011 | RNAseq | 0.2785 | 0.2911 | |
| SRP133303 | SRA1 | 10011 | RNAseq | 0.4540 | 0.0536 | |
| SRP159526 | SRA1 | 10011 | RNAseq | -0.2316 | 0.3212 | |
| SRP193095 | SRA1 | 10011 | RNAseq | -0.1035 | 0.2257 | |
| SRP219564 | SRA1 | 10011 | RNAseq | 0.1402 | 0.6521 | |
| TCGA | SRA1 | 10011 | RNAseq | -0.1318 | 0.0198 |
Upregulated datasets: 0; Downregulated datasets: 0.
Survival by SRA1 expression:
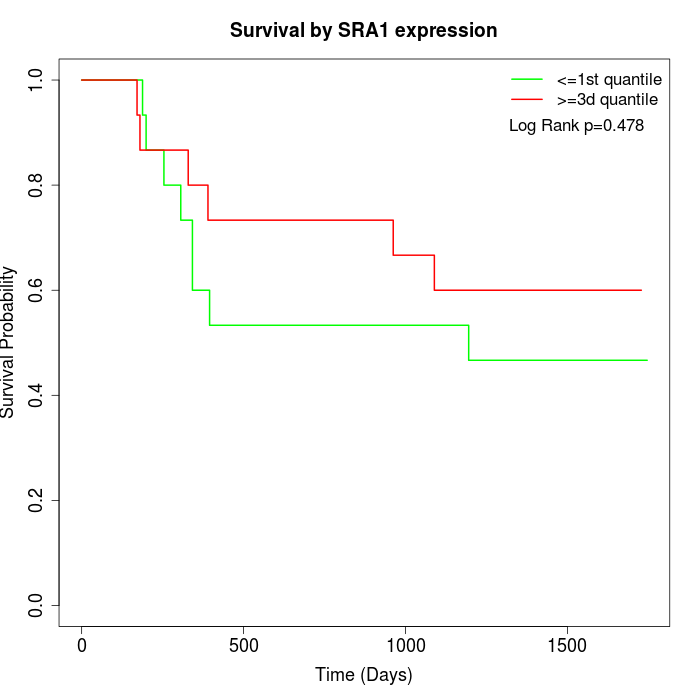 | 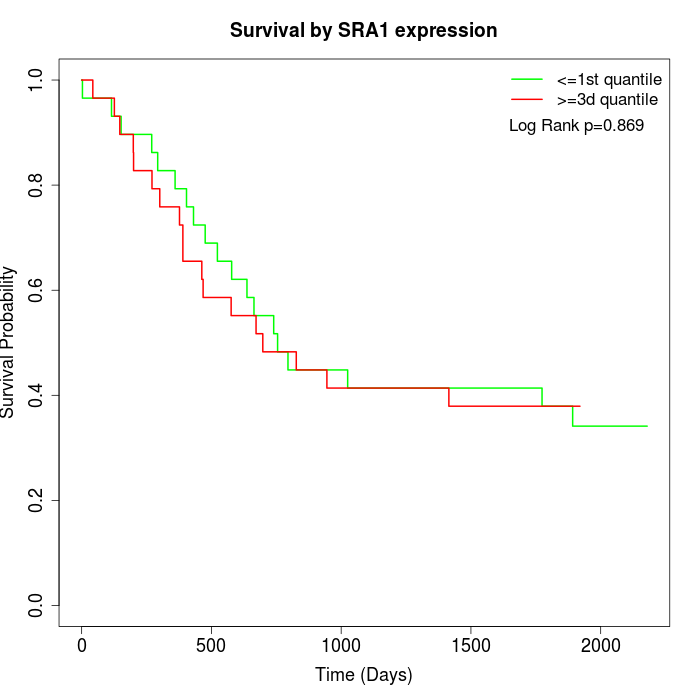 | 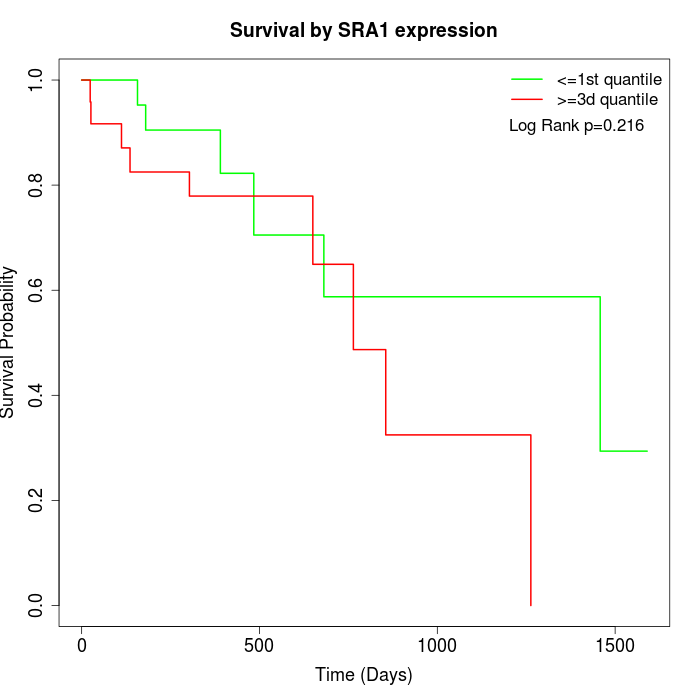 |
| GSE53622 | GSE53624 | TCGA |
Note: Click image to view full size file.
Copy number change of SRA1:
| Dataset | Gene | EntrezID | Gain | Loss | Normal | Detail |
|---|---|---|---|---|---|---|
| GSE15526 | SRA1 | 10011 | 3 | 11 | 16 | |
| GSE20123 | SRA1 | 10011 | 4 | 11 | 15 | |
| GSE43470 | SRA1 | 10011 | 2 | 10 | 31 | |
| GSE46452 | SRA1 | 10011 | 0 | 27 | 32 | |
| GSE47630 | SRA1 | 10011 | 0 | 20 | 20 | |
| GSE54993 | SRA1 | 10011 | 9 | 1 | 60 | |
| GSE54994 | SRA1 | 10011 | 2 | 14 | 37 | |
| GSE60625 | SRA1 | 10011 | 0 | 0 | 11 | |
| GSE74703 | SRA1 | 10011 | 2 | 7 | 27 | |
| GSE74704 | SRA1 | 10011 | 3 | 5 | 12 | |
| TCGA | SRA1 | 10011 | 4 | 37 | 55 |
Total number of gains: 29; Total number of losses: 143; Total Number of normals: 316.
Somatic mutations of SRA1:
Generating mutation plots.
Highly correlated genes for SRA1:
Showing top 20/278 corelated genes with mean PCC>0.5.
| Gene1 | Gene2 | Mean PCC | Num. Datasets | Num. PCC<0 | Num. PCC>0.5 |
|---|---|---|---|---|---|
| SRA1 | PIGL | 0.768306 | 3 | 0 | 3 |
| SRA1 | GFM2 | 0.760205 | 3 | 0 | 3 |
| SRA1 | MNT | 0.747164 | 3 | 0 | 3 |
| SRA1 | SPATS2 | 0.738101 | 3 | 0 | 3 |
| SRA1 | CDKN2D | 0.733915 | 3 | 0 | 3 |
| SRA1 | CSNK1G2 | 0.725936 | 3 | 0 | 3 |
| SRA1 | IL18BP | 0.718654 | 3 | 0 | 3 |
| SRA1 | A1BG | 0.711733 | 4 | 0 | 4 |
| SRA1 | OSGEP | 0.710861 | 3 | 0 | 3 |
| SRA1 | TNPO1 | 0.709202 | 3 | 0 | 3 |
| SRA1 | AIMP1 | 0.70752 | 3 | 0 | 3 |
| SRA1 | COQ4 | 0.705822 | 3 | 0 | 3 |
| SRA1 | SGPP1 | 0.705348 | 4 | 0 | 4 |
| SRA1 | UAP1L1 | 0.703273 | 3 | 0 | 3 |
| SRA1 | C12orf75 | 0.698612 | 3 | 0 | 3 |
| SRA1 | SDHAF2 | 0.6855 | 3 | 0 | 3 |
| SRA1 | ST3GAL2 | 0.68547 | 4 | 0 | 3 |
| SRA1 | CRCP | 0.684494 | 3 | 0 | 3 |
| SRA1 | TEP1 | 0.683516 | 3 | 0 | 3 |
| SRA1 | MZT2B | 0.682193 | 3 | 0 | 3 |
For details and further investigation, click here