| Full name: torsin 1A interacting protein 2 | Alias Symbol: LULL1|NET9|IFRG15 | ||
| Type: protein-coding gene | Cytoband: 1q25.2 | ||
| Entrez ID: 163590 | HGNC ID: HGNC:24055 | Ensembl Gene: ENSG00000169905 | OMIM ID: 614513 |
Screen Evidence:
| |||
Expression of TOR1AIP2:
| Dataset | Gene | EntrezID | Probe | Log2FC | Adj.pValue | Expression |
|---|---|---|---|---|---|---|
| GSE17351 | TOR1AIP2 | 163590 | 225880_at | 0.1899 | 0.7178 | |
| GSE20347 | TOR1AIP2 | 163590 | 214801_at | -0.1381 | 0.3578 | |
| GSE23400 | TOR1AIP2 | 163590 | 214801_at | 0.1287 | 0.0485 | |
| GSE26886 | TOR1AIP2 | 163590 | 225880_at | -0.3845 | 0.0678 | |
| GSE29001 | TOR1AIP2 | 163590 | 214801_at | -0.1002 | 0.7416 | |
| GSE38129 | TOR1AIP2 | 163590 | 214801_at | 0.0614 | 0.6152 | |
| GSE45670 | TOR1AIP2 | 163590 | 225880_at | 0.0489 | 0.7953 | |
| GSE53622 | TOR1AIP2 | 163590 | 34919 | 0.0389 | 0.5684 | |
| GSE53624 | TOR1AIP2 | 163590 | 1066 | -0.2123 | 0.0001 | |
| GSE63941 | TOR1AIP2 | 163590 | 225880_at | -0.7470 | 0.0894 | |
| GSE77861 | TOR1AIP2 | 163590 | 225880_at | -0.0530 | 0.8578 | |
| GSE97050 | TOR1AIP2 | 163590 | A_23_P390722 | -0.1400 | 0.8454 | |
| SRP007169 | TOR1AIP2 | 163590 | RNAseq | -1.5820 | 0.0000 | |
| SRP008496 | TOR1AIP2 | 163590 | RNAseq | -1.2285 | 0.0000 | |
| SRP064894 | TOR1AIP2 | 163590 | RNAseq | -0.7102 | 0.0000 | |
| SRP133303 | TOR1AIP2 | 163590 | RNAseq | -0.0171 | 0.9327 | |
| SRP159526 | TOR1AIP2 | 163590 | RNAseq | -0.1281 | 0.5254 | |
| SRP193095 | TOR1AIP2 | 163590 | RNAseq | -0.6406 | 0.0000 | |
| SRP219564 | TOR1AIP2 | 163590 | RNAseq | -0.2271 | 0.5470 | |
| TCGA | TOR1AIP2 | 163590 | RNAseq | -0.1025 | 0.0589 |
Upregulated datasets: 0; Downregulated datasets: 2.
Survival by TOR1AIP2 expression:
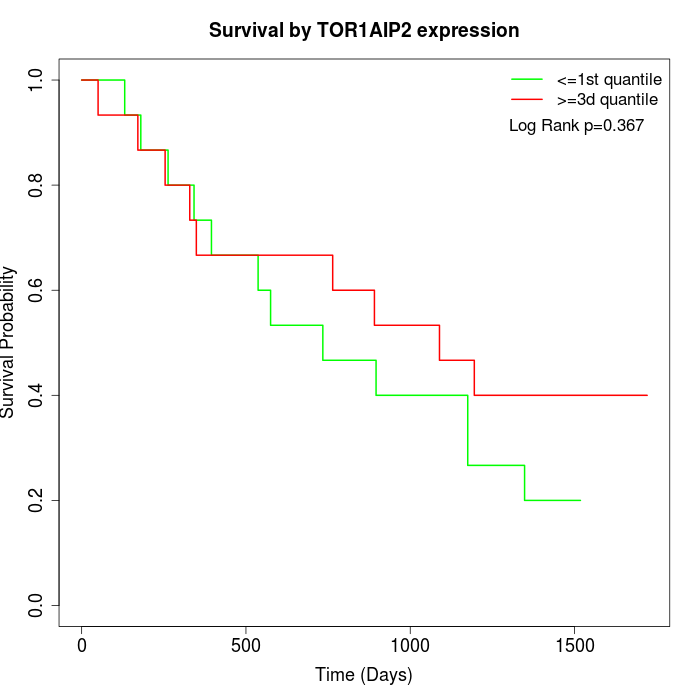 | 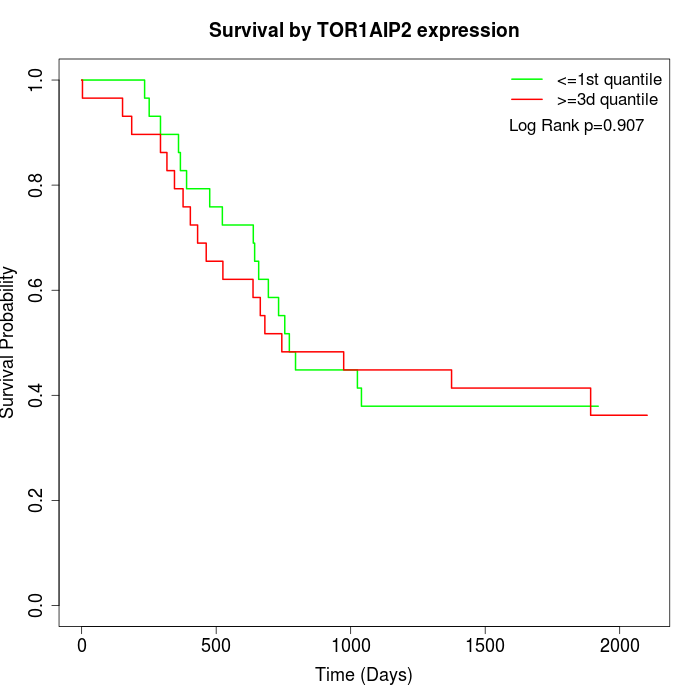 | 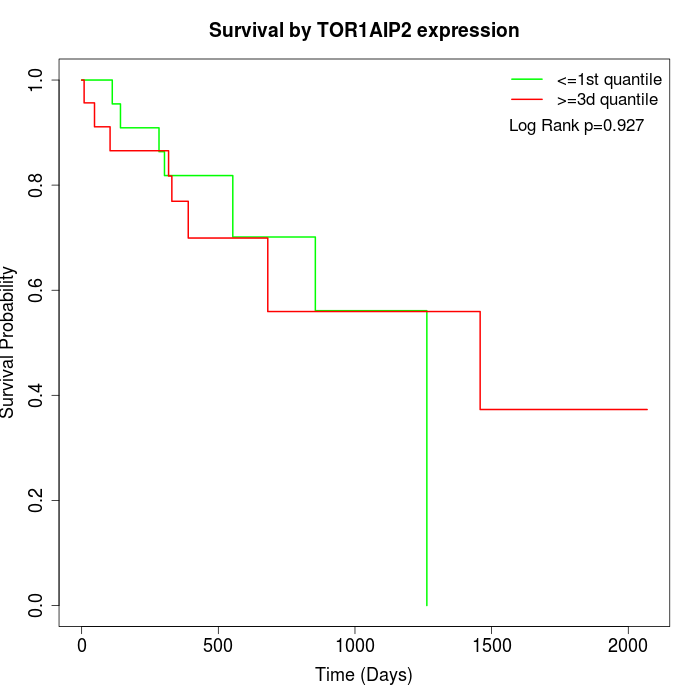 |
| GSE53622 | GSE53624 | TCGA |
Note: Click image to view full size file.
Copy number change of TOR1AIP2:
| Dataset | Gene | EntrezID | Gain | Loss | Normal | Detail |
|---|---|---|---|---|---|---|
| GSE15526 | TOR1AIP2 | 163590 | 12 | 0 | 18 | |
| GSE20123 | TOR1AIP2 | 163590 | 12 | 0 | 18 | |
| GSE43470 | TOR1AIP2 | 163590 | 7 | 1 | 35 | |
| GSE46452 | TOR1AIP2 | 163590 | 3 | 1 | 55 | |
| GSE47630 | TOR1AIP2 | 163590 | 14 | 0 | 26 | |
| GSE54993 | TOR1AIP2 | 163590 | 0 | 6 | 64 | |
| GSE54994 | TOR1AIP2 | 163590 | 15 | 0 | 38 | |
| GSE60625 | TOR1AIP2 | 163590 | 0 | 0 | 11 | |
| GSE74703 | TOR1AIP2 | 163590 | 7 | 1 | 28 | |
| GSE74704 | TOR1AIP2 | 163590 | 5 | 0 | 15 | |
| TCGA | TOR1AIP2 | 163590 | 40 | 3 | 53 |
Total number of gains: 115; Total number of losses: 12; Total Number of normals: 361.
Somatic mutations of TOR1AIP2:
Generating mutation plots.
Highly correlated genes for TOR1AIP2:
Showing top 20/235 corelated genes with mean PCC>0.5.
| Gene1 | Gene2 | Mean PCC | Num. Datasets | Num. PCC<0 | Num. PCC>0.5 |
|---|---|---|---|---|---|
| TOR1AIP2 | PPM1A | 0.76324 | 3 | 0 | 3 |
| TOR1AIP2 | ZNF808 | 0.742407 | 3 | 0 | 3 |
| TOR1AIP2 | GPBP1 | 0.737681 | 3 | 0 | 3 |
| TOR1AIP2 | RXRA | 0.736008 | 3 | 0 | 3 |
| TOR1AIP2 | STAM2 | 0.728978 | 3 | 0 | 3 |
| TOR1AIP2 | SRD5A3 | 0.713762 | 3 | 0 | 3 |
| TOR1AIP2 | WDR11 | 0.713499 | 3 | 0 | 3 |
| TOR1AIP2 | STK38 | 0.699381 | 3 | 0 | 3 |
| TOR1AIP2 | REST | 0.697951 | 3 | 0 | 3 |
| TOR1AIP2 | GGA3 | 0.694622 | 3 | 0 | 3 |
| TOR1AIP2 | COPB1 | 0.694233 | 4 | 0 | 4 |
| TOR1AIP2 | ZRANB1 | 0.680294 | 3 | 0 | 3 |
| TOR1AIP2 | TPCN1 | 0.673988 | 3 | 0 | 3 |
| TOR1AIP2 | ARL10 | 0.668537 | 3 | 0 | 3 |
| TOR1AIP2 | ZNF83 | 0.668151 | 3 | 0 | 3 |
| TOR1AIP2 | RUFY1 | 0.665613 | 3 | 0 | 3 |
| TOR1AIP2 | PLEKHA2 | 0.664827 | 3 | 0 | 3 |
| TOR1AIP2 | RASSF5 | 0.661355 | 3 | 0 | 3 |
| TOR1AIP2 | USP4 | 0.661244 | 3 | 0 | 3 |
| TOR1AIP2 | DDX52 | 0.659274 | 6 | 0 | 4 |
For details and further investigation, click here