| Full name: signal transducing adaptor family member 1 | Alias Symbol: STAP-1|BRDG1 | ||
| Type: protein-coding gene | Cytoband: 4q13.2 | ||
| Entrez ID: 26228 | HGNC ID: HGNC:24133 | Ensembl Gene: ENSG00000035720 | OMIM ID: 604298 |
Expression of STAP1:
| Dataset | Gene | EntrezID | Probe | Log2FC | Adj.pValue | Expression |
|---|---|---|---|---|---|---|
| GSE17351 | STAP1 | 26228 | 1554343_a_at | 0.2587 | 0.7749 | |
| GSE20347 | STAP1 | 26228 | 220059_at | 0.1216 | 0.3151 | |
| GSE23400 | STAP1 | 26228 | 220059_at | -0.0427 | 0.1888 | |
| GSE26886 | STAP1 | 26228 | 220059_at | 0.1796 | 0.1496 | |
| GSE29001 | STAP1 | 26228 | 220059_at | 0.2012 | 0.2225 | |
| GSE38129 | STAP1 | 26228 | 220059_at | -0.0291 | 0.9046 | |
| GSE45670 | STAP1 | 26228 | 1554343_a_at | -0.0935 | 0.5605 | |
| GSE53622 | STAP1 | 26228 | 56960 | -0.4081 | 0.1059 | |
| GSE53624 | STAP1 | 26228 | 56960 | -0.8532 | 0.0001 | |
| GSE63941 | STAP1 | 26228 | 1554343_a_at | 0.0338 | 0.7909 | |
| GSE77861 | STAP1 | 26228 | 1554343_a_at | -0.0558 | 0.6496 | |
| GSE97050 | STAP1 | 26228 | A_33_P3365760 | 0.5503 | 0.2680 | |
| SRP133303 | STAP1 | 26228 | RNAseq | -0.1735 | 0.7502 | |
| SRP159526 | STAP1 | 26228 | RNAseq | -1.2411 | 0.1987 | |
| TCGA | STAP1 | 26228 | RNAseq | -0.4374 | 0.3704 |
Upregulated datasets: 0; Downregulated datasets: 0.
Survival by STAP1 expression:
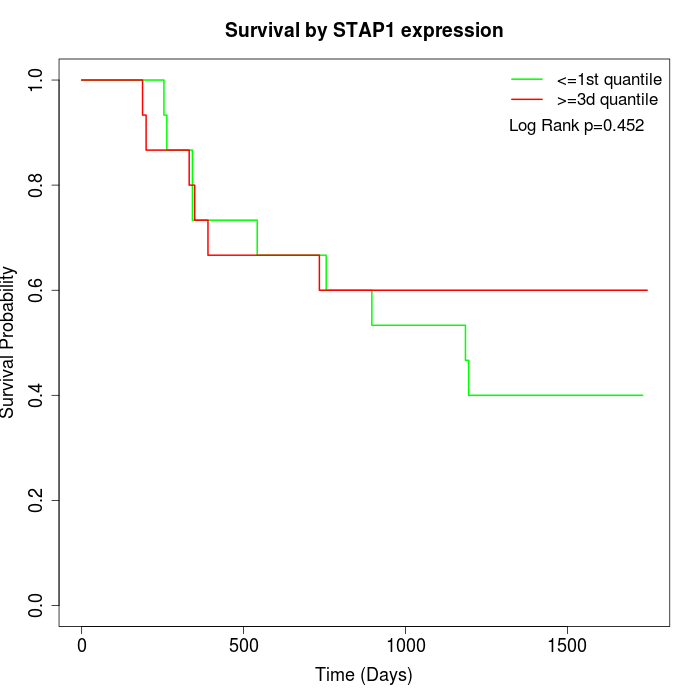 | 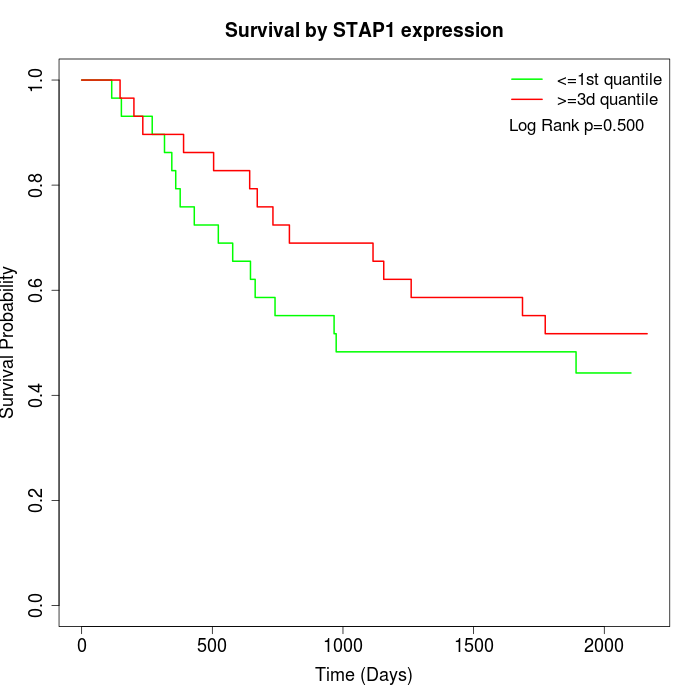 |  |
| GSE53622 | GSE53624 | TCGA |
Note: Click image to view full size file.
Copy number change of STAP1:
| Dataset | Gene | EntrezID | Gain | Loss | Normal | Detail |
|---|---|---|---|---|---|---|
| GSE15526 | STAP1 | 26228 | 2 | 11 | 17 | |
| GSE20123 | STAP1 | 26228 | 2 | 12 | 16 | |
| GSE43470 | STAP1 | 26228 | 0 | 13 | 30 | |
| GSE46452 | STAP1 | 26228 | 2 | 35 | 22 | |
| GSE47630 | STAP1 | 26228 | 0 | 19 | 21 | |
| GSE54993 | STAP1 | 26228 | 7 | 0 | 63 | |
| GSE54994 | STAP1 | 26228 | 1 | 9 | 43 | |
| GSE60625 | STAP1 | 26228 | 0 | 0 | 11 | |
| GSE74703 | STAP1 | 26228 | 0 | 11 | 25 | |
| GSE74704 | STAP1 | 26228 | 1 | 8 | 11 | |
| TCGA | STAP1 | 26228 | 18 | 27 | 51 |
Total number of gains: 33; Total number of losses: 145; Total Number of normals: 310.
Somatic mutations of STAP1:
Generating mutation plots.
Highly correlated genes for STAP1:
Showing top 20/280 corelated genes with mean PCC>0.5.
| Gene1 | Gene2 | Mean PCC | Num. Datasets | Num. PCC<0 | Num. PCC>0.5 |
|---|---|---|---|---|---|
| STAP1 | FCRL3 | 0.770506 | 6 | 0 | 6 |
| STAP1 | FCRLA | 0.757217 | 6 | 0 | 5 |
| STAP1 | POU2AF1 | 0.73599 | 4 | 0 | 4 |
| STAP1 | GAPT | 0.732326 | 5 | 0 | 5 |
| STAP1 | BTLA | 0.720789 | 5 | 0 | 5 |
| STAP1 | PTPN22 | 0.717349 | 4 | 0 | 4 |
| STAP1 | CLEC17A | 0.706981 | 3 | 0 | 3 |
| STAP1 | LINC01215 | 0.705069 | 5 | 0 | 4 |
| STAP1 | GPATCH4 | 0.700593 | 3 | 0 | 3 |
| STAP1 | PSMB8-AS1 | 0.698718 | 3 | 0 | 3 |
| STAP1 | IL2RG | 0.687397 | 6 | 0 | 6 |
| STAP1 | THEMIS | 0.685767 | 3 | 0 | 3 |
| STAP1 | KPNA2 | 0.679939 | 3 | 0 | 3 |
| STAP1 | IRF4 | 0.678661 | 9 | 0 | 7 |
| STAP1 | MS4A1 | 0.67751 | 10 | 0 | 8 |
| STAP1 | TCL1A | 0.677379 | 8 | 0 | 6 |
| STAP1 | TAGAP | 0.677338 | 5 | 0 | 5 |
| STAP1 | BLK | 0.672663 | 6 | 0 | 5 |
| STAP1 | GPR18 | 0.671897 | 8 | 0 | 6 |
| STAP1 | CD22 | 0.670981 | 10 | 0 | 8 |
For details and further investigation, click here