| Full name: BLK proto-oncogene, Src family tyrosine kinase | Alias Symbol: MGC10442 | ||
| Type: protein-coding gene | Cytoband: 8p23.1 | ||
| Entrez ID: 640 | HGNC ID: HGNC:1057 | Ensembl Gene: ENSG00000136573 | OMIM ID: 191305 |
| Related drugs: ACALABRUTINIB, CEP-11981, CHEMBL1229592, DASATINIB, ENMD-2076, ENMD-981693, IBRUTINIB, ILORASERTIB, NINTEDANIB, TG100-801... [more] | |||
Expression of BLK:
| Dataset | Gene | EntrezID | Probe | Log2FC | Adj.pValue | Expression |
|---|---|---|---|---|---|---|
| GSE17351 | BLK | 640 | 206255_at | -0.0370 | 0.9799 | |
| GSE20347 | BLK | 640 | 210934_at | -0.0460 | 0.5343 | |
| GSE23400 | BLK | 640 | 210934_at | -0.2035 | 0.0000 | |
| GSE26886 | BLK | 640 | 210934_at | 0.0115 | 0.9365 | |
| GSE29001 | BLK | 640 | 210934_at | -0.0208 | 0.9207 | |
| GSE38129 | BLK | 640 | 210934_at | -0.0686 | 0.4602 | |
| GSE45670 | BLK | 640 | 210934_at | -0.0051 | 0.9720 | |
| GSE53622 | BLK | 640 | 153600 | -1.0232 | 0.0000 | |
| GSE53624 | BLK | 640 | 153600 | -1.1596 | 0.0000 | |
| GSE63941 | BLK | 640 | 210934_at | 0.0214 | 0.8840 | |
| GSE77861 | BLK | 640 | 210934_at | -0.0728 | 0.6521 | |
| GSE97050 | BLK | 640 | A_23_P31725 | 0.2877 | 0.4731 | |
| SRP133303 | BLK | 640 | RNAseq | -1.8071 | 0.0007 | |
| SRP159526 | BLK | 640 | RNAseq | -2.4956 | 0.1601 | |
| TCGA | BLK | 640 | RNAseq | -1.7474 | 0.0182 |
Upregulated datasets: 0; Downregulated datasets: 4.
Survival by BLK expression:
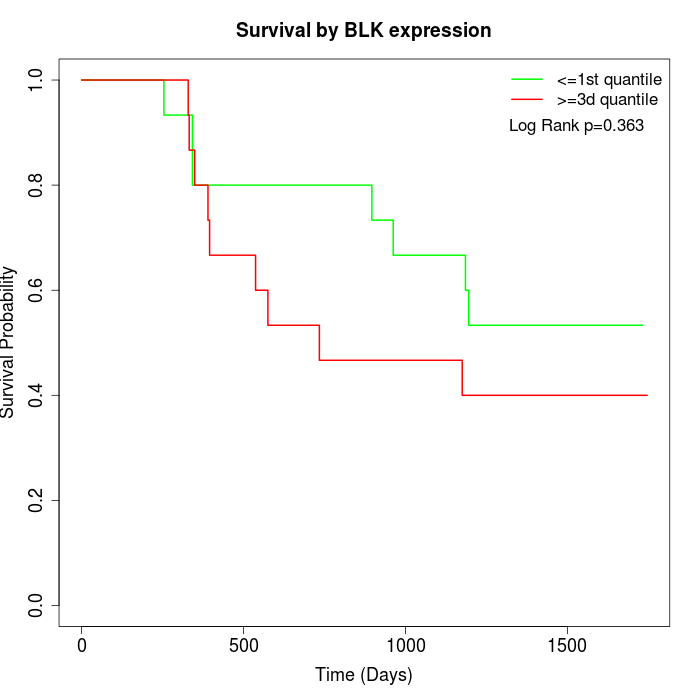 | 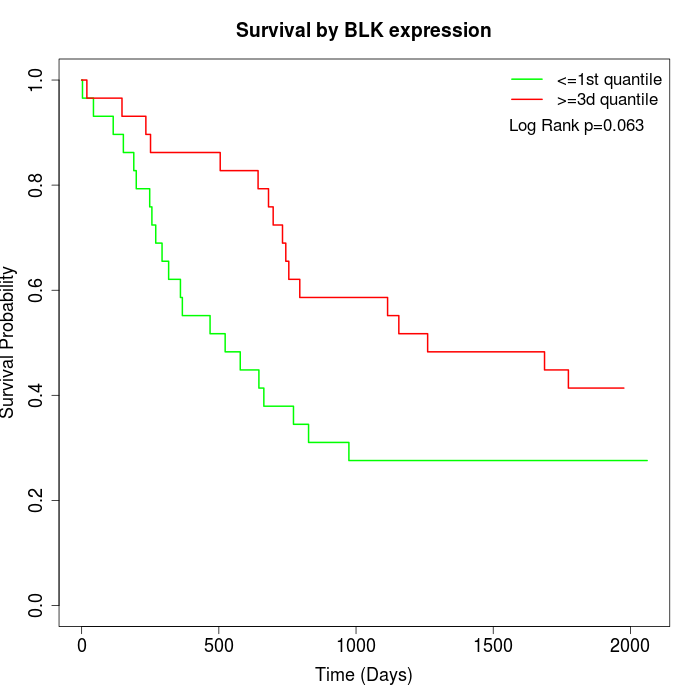 | 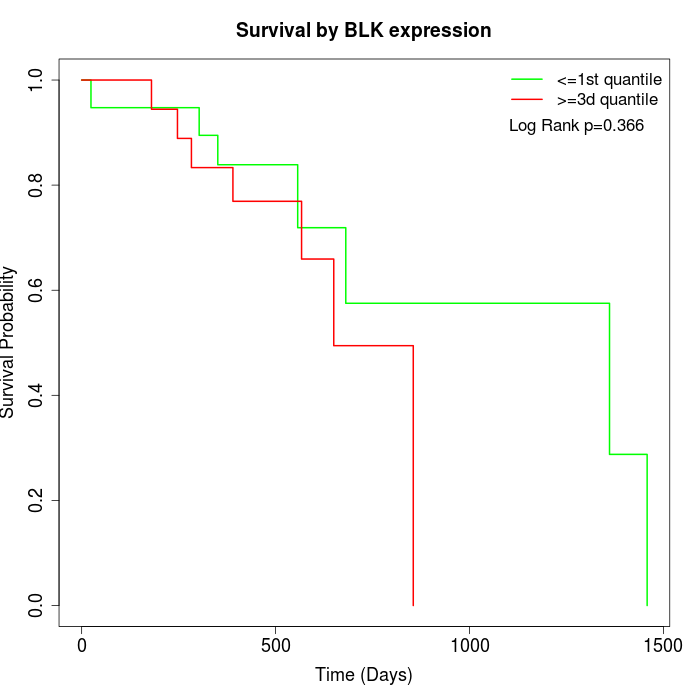 |
| GSE53622 | GSE53624 | TCGA |
Note: Click image to view full size file.
Copy number change of BLK:
| Dataset | Gene | EntrezID | Gain | Loss | Normal | Detail |
|---|---|---|---|---|---|---|
| GSE15526 | BLK | 640 | 4 | 11 | 15 | |
| GSE20123 | BLK | 640 | 4 | 11 | 15 | |
| GSE43470 | BLK | 640 | 4 | 9 | 30 | |
| GSE46452 | BLK | 640 | 12 | 14 | 33 | |
| GSE47630 | BLK | 640 | 10 | 7 | 23 | |
| GSE54993 | BLK | 640 | 3 | 14 | 53 | |
| GSE54994 | BLK | 640 | 8 | 19 | 26 | |
| GSE60625 | BLK | 640 | 3 | 0 | 8 | |
| GSE74703 | BLK | 640 | 4 | 7 | 25 | |
| GSE74704 | BLK | 640 | 3 | 7 | 10 | |
| TCGA | BLK | 640 | 14 | 39 | 43 |
Total number of gains: 69; Total number of losses: 138; Total Number of normals: 281.
Somatic mutations of BLK:
Generating mutation plots.
Highly correlated genes for BLK:
Showing top 20/582 corelated genes with mean PCC>0.5.
| Gene1 | Gene2 | Mean PCC | Num. Datasets | Num. PCC<0 | Num. PCC>0.5 |
|---|---|---|---|---|---|
| BLK | KCNS1 | 0.786865 | 3 | 0 | 3 |
| BLK | LINC01215 | 0.753371 | 4 | 0 | 4 |
| BLK | FCRL1 | 0.727706 | 3 | 0 | 3 |
| BLK | MS4A1 | 0.726103 | 6 | 0 | 5 |
| BLK | IRF4 | 0.72597 | 5 | 0 | 5 |
| BLK | TBC1D10C | 0.718005 | 4 | 0 | 4 |
| BLK | RNF123 | 0.717613 | 3 | 0 | 3 |
| BLK | TRAT1 | 0.699186 | 4 | 0 | 4 |
| BLK | CD52 | 0.696859 | 4 | 0 | 3 |
| BLK | ARSA | 0.689216 | 3 | 0 | 3 |
| BLK | PYHIN1 | 0.688661 | 3 | 0 | 3 |
| BLK | DNMT3L | 0.688198 | 3 | 0 | 3 |
| BLK | ATP8B3 | 0.686258 | 3 | 0 | 3 |
| BLK | FTCD | 0.685325 | 3 | 0 | 3 |
| BLK | BTLA | 0.681577 | 5 | 0 | 4 |
| BLK | STAP1 | 0.672663 | 6 | 0 | 5 |
| BLK | PTPRCAP | 0.670626 | 5 | 0 | 4 |
| BLK | GJC2 | 0.67053 | 4 | 0 | 4 |
| BLK | G6PC2 | 0.669546 | 4 | 0 | 4 |
| BLK | FCRLA | 0.668784 | 7 | 0 | 5 |
For details and further investigation, click here