| Full name: signal transducer and activator of transcription 1 | Alias Symbol: STAT91|ISGF-3 | ||
| Type: protein-coding gene | Cytoband: 2q32.2 | ||
| Entrez ID: 6772 | HGNC ID: HGNC:11362 | Ensembl Gene: ENSG00000115415 | OMIM ID: 600555 |
STAT1 involved pathways:
Expression of STAT1:
| Dataset | Gene | EntrezID | Probe | Log2FC | Adj.pValue | Expression |
|---|---|---|---|---|---|---|
| GSE17351 | STAT1 | 6772 | 200887_s_at | 0.6247 | 0.4179 | |
| GSE20347 | STAT1 | 6772 | 200887_s_at | 0.6692 | 0.0267 | |
| GSE23400 | STAT1 | 6772 | 200887_s_at | 1.0121 | 0.0000 | |
| GSE26886 | STAT1 | 6772 | 200887_s_at | 0.5629 | 0.0754 | |
| GSE29001 | STAT1 | 6772 | 200887_s_at | 0.8956 | 0.0350 | |
| GSE38129 | STAT1 | 6772 | 200887_s_at | 0.7198 | 0.0008 | |
| GSE45670 | STAT1 | 6772 | 200887_s_at | 1.2629 | 0.0002 | |
| GSE53622 | STAT1 | 6772 | 45544 | 1.6062 | 0.0000 | |
| GSE53624 | STAT1 | 6772 | 45544 | 1.7456 | 0.0000 | |
| GSE63941 | STAT1 | 6772 | 200887_s_at | -2.2553 | 0.0007 | |
| GSE77861 | STAT1 | 6772 | 200887_s_at | 0.4006 | 0.1837 | |
| GSE97050 | STAT1 | 6772 | A_24_P274270 | 1.5916 | 0.0782 | |
| SRP007169 | STAT1 | 6772 | RNAseq | 1.6899 | 0.0063 | |
| SRP008496 | STAT1 | 6772 | RNAseq | 1.1018 | 0.0112 | |
| SRP064894 | STAT1 | 6772 | RNAseq | 1.8903 | 0.0000 | |
| SRP133303 | STAT1 | 6772 | RNAseq | 1.0670 | 0.0020 | |
| SRP159526 | STAT1 | 6772 | RNAseq | 0.6094 | 0.3227 | |
| SRP193095 | STAT1 | 6772 | RNAseq | 1.1571 | 0.0000 | |
| SRP219564 | STAT1 | 6772 | RNAseq | 1.8539 | 0.0122 | |
| TCGA | STAT1 | 6772 | RNAseq | 0.3731 | 0.0000 |
Upregulated datasets: 10; Downregulated datasets: 1.
Survival by STAT1 expression:
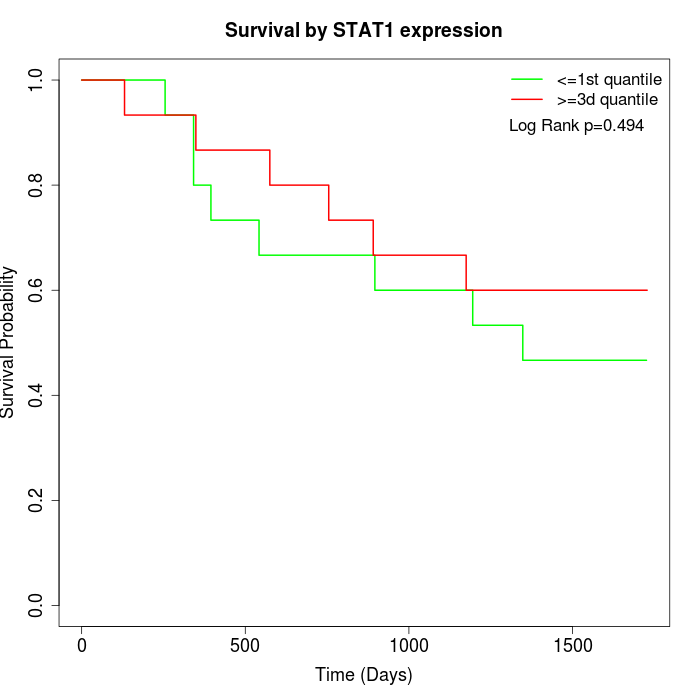 | 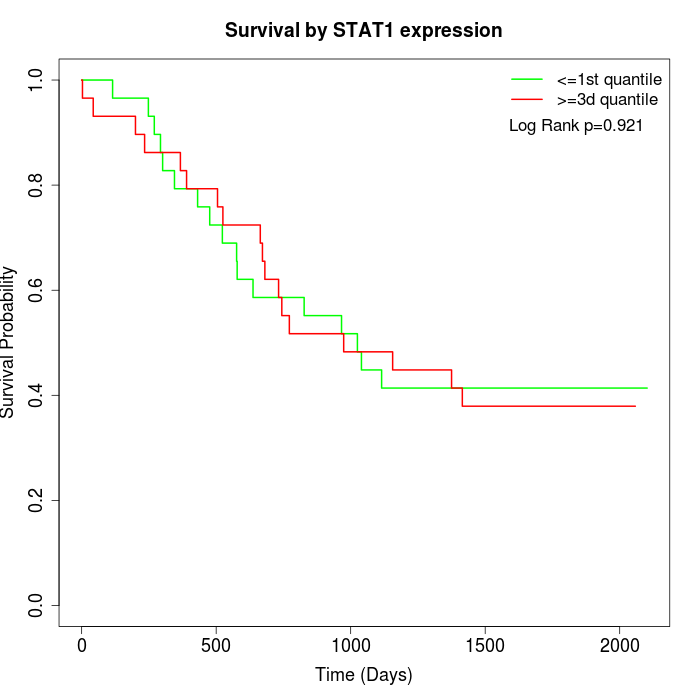 | 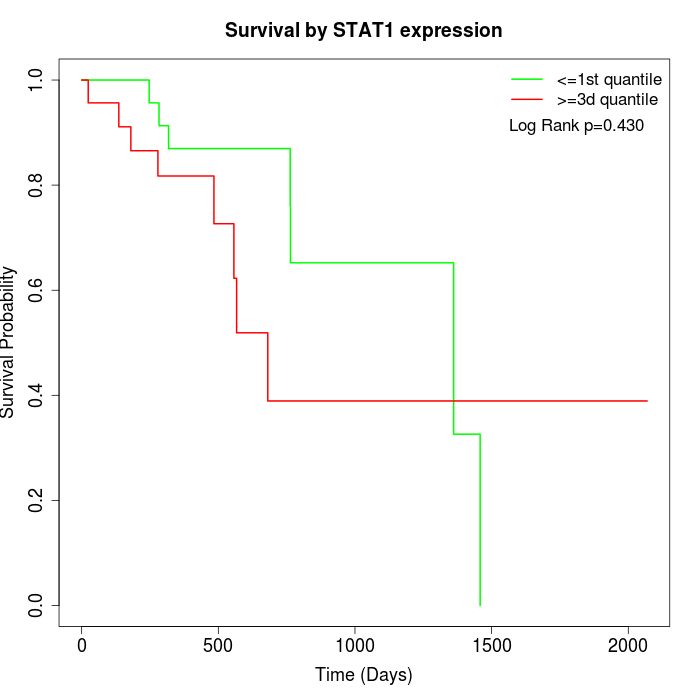 |
| GSE53622 | GSE53624 | TCGA |
Note: Click image to view full size file.
Copy number change of STAT1:
| Dataset | Gene | EntrezID | Gain | Loss | Normal | Detail |
|---|---|---|---|---|---|---|
| GSE15526 | STAT1 | 6772 | 8 | 2 | 20 | |
| GSE20123 | STAT1 | 6772 | 8 | 2 | 20 | |
| GSE43470 | STAT1 | 6772 | 3 | 1 | 39 | |
| GSE46452 | STAT1 | 6772 | 1 | 4 | 54 | |
| GSE47630 | STAT1 | 6772 | 4 | 5 | 31 | |
| GSE54993 | STAT1 | 6772 | 0 | 5 | 65 | |
| GSE54994 | STAT1 | 6772 | 12 | 6 | 35 | |
| GSE60625 | STAT1 | 6772 | 0 | 3 | 8 | |
| GSE74703 | STAT1 | 6772 | 2 | 1 | 33 | |
| GSE74704 | STAT1 | 6772 | 3 | 2 | 15 | |
| TCGA | STAT1 | 6772 | 24 | 8 | 64 |
Total number of gains: 65; Total number of losses: 39; Total Number of normals: 384.
Somatic mutations of STAT1:
Generating mutation plots.
Highly correlated genes for STAT1:
Showing top 20/763 corelated genes with mean PCC>0.5.
| Gene1 | Gene2 | Mean PCC | Num. Datasets | Num. PCC<0 | Num. PCC>0.5 |
|---|---|---|---|---|---|
| STAT1 | USP41 | 0.847707 | 3 | 0 | 3 |
| STAT1 | GBP1 | 0.786514 | 12 | 0 | 12 |
| STAT1 | DDX60L | 0.785708 | 7 | 0 | 6 |
| STAT1 | PARP14 | 0.784421 | 8 | 0 | 8 |
| STAT1 | DDX60 | 0.774373 | 13 | 0 | 13 |
| STAT1 | PSME2 | 0.768402 | 4 | 0 | 4 |
| STAT1 | IFI6 | 0.764991 | 13 | 0 | 13 |
| STAT1 | EPSTI1 | 0.764941 | 9 | 0 | 8 |
| STAT1 | TAP1 | 0.763766 | 11 | 0 | 11 |
| STAT1 | CMPK2 | 0.756103 | 8 | 0 | 7 |
| STAT1 | IFIH1 | 0.749477 | 11 | 0 | 9 |
| STAT1 | UBE2L6 | 0.748991 | 12 | 0 | 11 |
| STAT1 | SP110 | 0.748123 | 12 | 0 | 11 |
| STAT1 | XAF1 | 0.74269 | 13 | 0 | 13 |
| STAT1 | IFI44 | 0.740043 | 13 | 0 | 12 |
| STAT1 | RSAD2 | 0.737645 | 12 | 0 | 11 |
| STAT1 | OAS3 | 0.727661 | 12 | 0 | 12 |
| STAT1 | PARP9 | 0.726589 | 8 | 0 | 8 |
| STAT1 | ISG15 | 0.726197 | 13 | 0 | 13 |
| STAT1 | NMI | 0.725798 | 11 | 0 | 10 |
For details and further investigation, click here