| Full name: serine/threonine kinase 11 interacting protein | Alias Symbol: LIP1|KIAA1898|LKB1IP|STK11IP1 | ||
| Type: protein-coding gene | Cytoband: 2q35 | ||
| Entrez ID: 114790 | HGNC ID: HGNC:19184 | Ensembl Gene: ENSG00000144589 | OMIM ID: 607172 |
Screen Evidence:
| |||
Expression of STK11IP:
| Dataset | Gene | EntrezID | Probe | Log2FC | Adj.pValue | Expression |
|---|---|---|---|---|---|---|
| GSE17351 | STK11IP | 114790 | 225713_at | 0.2329 | 0.6051 | |
| GSE26886 | STK11IP | 114790 | 225713_at | -0.3070 | 0.0164 | |
| GSE45670 | STK11IP | 114790 | 225713_at | 0.3489 | 0.0031 | |
| GSE53622 | STK11IP | 114790 | 15522 | 0.2711 | 0.0005 | |
| GSE53624 | STK11IP | 114790 | 15522 | 0.2279 | 0.0001 | |
| GSE63941 | STK11IP | 114790 | 225713_at | 0.0920 | 0.7878 | |
| GSE77861 | STK11IP | 114790 | 225713_at | 0.1636 | 0.1894 | |
| GSE97050 | STK11IP | 114790 | A_23_P321320 | 0.0995 | 0.7900 | |
| SRP007169 | STK11IP | 114790 | RNAseq | 0.0393 | 0.9298 | |
| SRP008496 | STK11IP | 114790 | RNAseq | -0.1500 | 0.6282 | |
| SRP064894 | STK11IP | 114790 | RNAseq | 0.5896 | 0.0002 | |
| SRP133303 | STK11IP | 114790 | RNAseq | 0.1982 | 0.1856 | |
| SRP159526 | STK11IP | 114790 | RNAseq | 0.4429 | 0.2467 | |
| SRP193095 | STK11IP | 114790 | RNAseq | 0.1939 | 0.1156 | |
| SRP219564 | STK11IP | 114790 | RNAseq | 0.0618 | 0.7047 | |
| TCGA | STK11IP | 114790 | RNAseq | 0.0612 | 0.2930 |
Upregulated datasets: 0; Downregulated datasets: 0.
Survival by STK11IP expression:
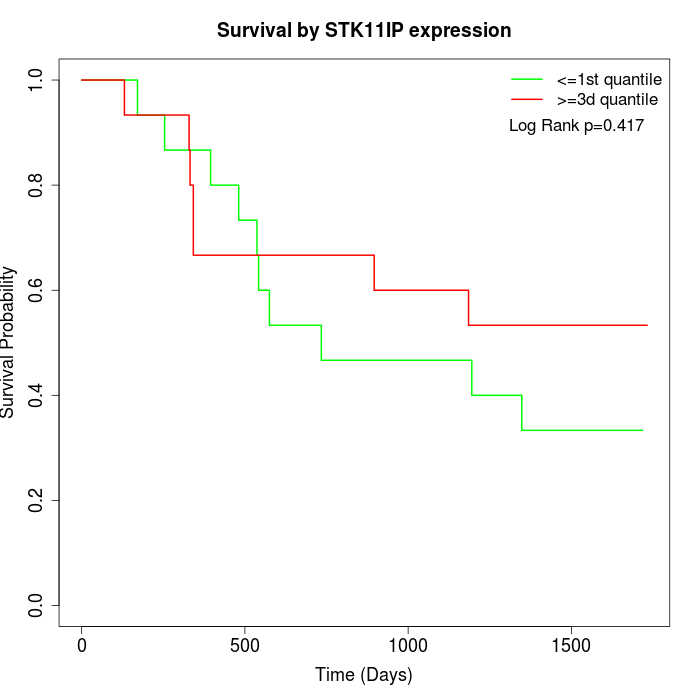 | 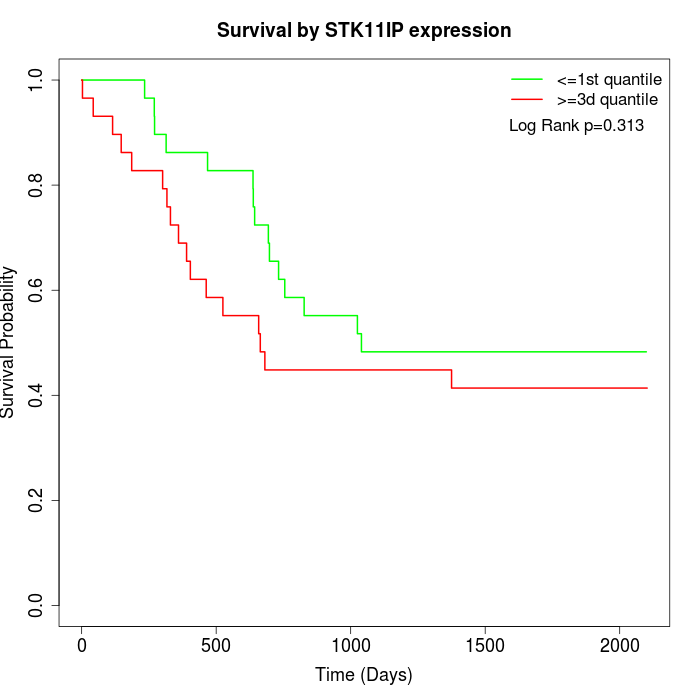 | 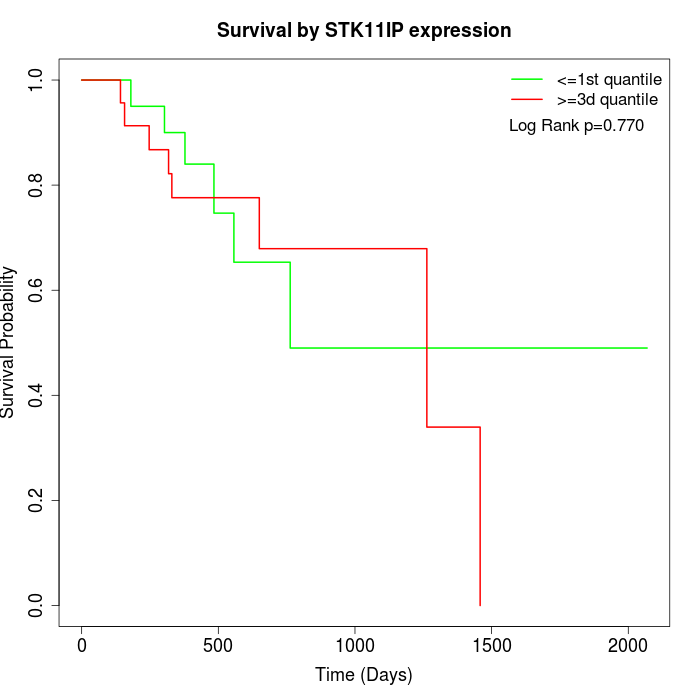 |
| GSE53622 | GSE53624 | TCGA |
Note: Click image to view full size file.
Copy number change of STK11IP:
| Dataset | Gene | EntrezID | Gain | Loss | Normal | Detail |
|---|---|---|---|---|---|---|
| GSE15526 | STK11IP | 114790 | 2 | 14 | 14 | |
| GSE20123 | STK11IP | 114790 | 2 | 13 | 15 | |
| GSE43470 | STK11IP | 114790 | 1 | 6 | 36 | |
| GSE46452 | STK11IP | 114790 | 0 | 5 | 54 | |
| GSE47630 | STK11IP | 114790 | 4 | 5 | 31 | |
| GSE54993 | STK11IP | 114790 | 1 | 2 | 67 | |
| GSE54994 | STK11IP | 114790 | 8 | 9 | 36 | |
| GSE60625 | STK11IP | 114790 | 0 | 3 | 8 | |
| GSE74703 | STK11IP | 114790 | 1 | 5 | 30 | |
| GSE74704 | STK11IP | 114790 | 2 | 7 | 11 | |
| TCGA | STK11IP | 114790 | 13 | 25 | 58 |
Total number of gains: 34; Total number of losses: 94; Total Number of normals: 360.
Somatic mutations of STK11IP:
Generating mutation plots.
Highly correlated genes for STK11IP:
Showing top 20/242 corelated genes with mean PCC>0.5.
| Gene1 | Gene2 | Mean PCC | Num. Datasets | Num. PCC<0 | Num. PCC>0.5 |
|---|---|---|---|---|---|
| STK11IP | DYNLRB1 | 0.770578 | 3 | 0 | 3 |
| STK11IP | CDK2AP2 | 0.769171 | 3 | 0 | 3 |
| STK11IP | ZNF213 | 0.72874 | 3 | 0 | 3 |
| STK11IP | APH1A | 0.723701 | 3 | 0 | 3 |
| STK11IP | POP5 | 0.718767 | 3 | 0 | 3 |
| STK11IP | RNF2 | 0.711181 | 3 | 0 | 3 |
| STK11IP | ELOF1 | 0.710118 | 4 | 0 | 4 |
| STK11IP | MTF1 | 0.708494 | 3 | 0 | 3 |
| STK11IP | FKBPL | 0.706872 | 3 | 0 | 3 |
| STK11IP | PIP4K2C | 0.698955 | 4 | 0 | 3 |
| STK11IP | CDK5RAP3 | 0.691262 | 4 | 0 | 4 |
| STK11IP | NFYC | 0.684175 | 3 | 0 | 3 |
| STK11IP | FOXJ3 | 0.683109 | 3 | 0 | 3 |
| STK11IP | WDR46 | 0.682433 | 3 | 0 | 3 |
| STK11IP | RUNDC1 | 0.682245 | 3 | 0 | 3 |
| STK11IP | UNG | 0.680571 | 4 | 0 | 3 |
| STK11IP | EPS15L1 | 0.67944 | 3 | 0 | 3 |
| STK11IP | GPS1 | 0.678174 | 3 | 0 | 3 |
| STK11IP | DOCK6 | 0.675775 | 4 | 0 | 3 |
| STK11IP | GRB2 | 0.672525 | 3 | 0 | 3 |
For details and further investigation, click here