| Full name: TAP binding protein like | Alias Symbol: TAPBP-R|FLJ10143|TAPBPR | ||
| Type: protein-coding gene | Cytoband: 12p13.31 | ||
| Entrez ID: 55080 | HGNC ID: HGNC:30683 | Ensembl Gene: ENSG00000139192 | OMIM ID: 607081 |
Expression of TAPBPL:
| Dataset | Gene | EntrezID | Probe | Log2FC | Adj.pValue | Expression |
|---|---|---|---|---|---|---|
| GSE17351 | TAPBPL | 55080 | 218746_at | 0.3452 | 0.4419 | |
| GSE20347 | TAPBPL | 55080 | 218747_s_at | 0.3832 | 0.0171 | |
| GSE23400 | TAPBPL | 55080 | 218746_at | 0.2419 | 0.0013 | |
| GSE26886 | TAPBPL | 55080 | 218747_s_at | 0.8143 | 0.0590 | |
| GSE29001 | TAPBPL | 55080 | 218746_at | 0.6582 | 0.0016 | |
| GSE38129 | TAPBPL | 55080 | 218747_s_at | 0.2508 | 0.0669 | |
| GSE45670 | TAPBPL | 55080 | 218747_s_at | 0.5459 | 0.0241 | |
| GSE53622 | TAPBPL | 55080 | 33285 | 0.7327 | 0.0000 | |
| GSE53624 | TAPBPL | 55080 | 33285 | 0.5148 | 0.0000 | |
| GSE63941 | TAPBPL | 55080 | 218746_at | 0.7597 | 0.3934 | |
| GSE77861 | TAPBPL | 55080 | 218747_s_at | 0.2308 | 0.5483 | |
| GSE97050 | TAPBPL | 55080 | A_23_P36700 | 0.4915 | 0.1390 | |
| SRP007169 | TAPBPL | 55080 | RNAseq | 1.0310 | 0.0988 | |
| SRP008496 | TAPBPL | 55080 | RNAseq | 0.8630 | 0.0381 | |
| SRP064894 | TAPBPL | 55080 | RNAseq | 0.4815 | 0.0529 | |
| SRP133303 | TAPBPL | 55080 | RNAseq | 0.7373 | 0.0091 | |
| SRP159526 | TAPBPL | 55080 | RNAseq | 0.3220 | 0.4070 | |
| SRP193095 | TAPBPL | 55080 | RNAseq | 0.2004 | 0.3787 | |
| SRP219564 | TAPBPL | 55080 | RNAseq | 0.6576 | 0.1873 | |
| TCGA | TAPBPL | 55080 | RNAseq | 0.0330 | 0.7063 |
Upregulated datasets: 0; Downregulated datasets: 0.
Survival by TAPBPL expression:
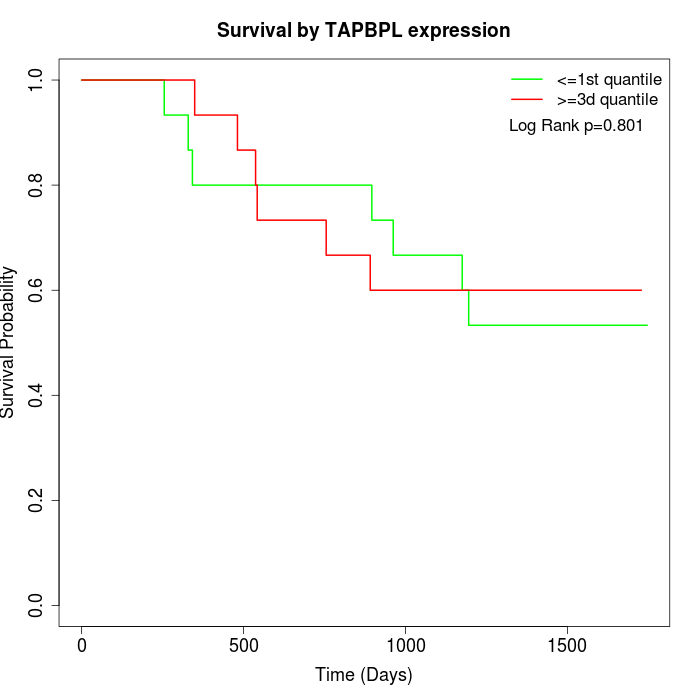 | 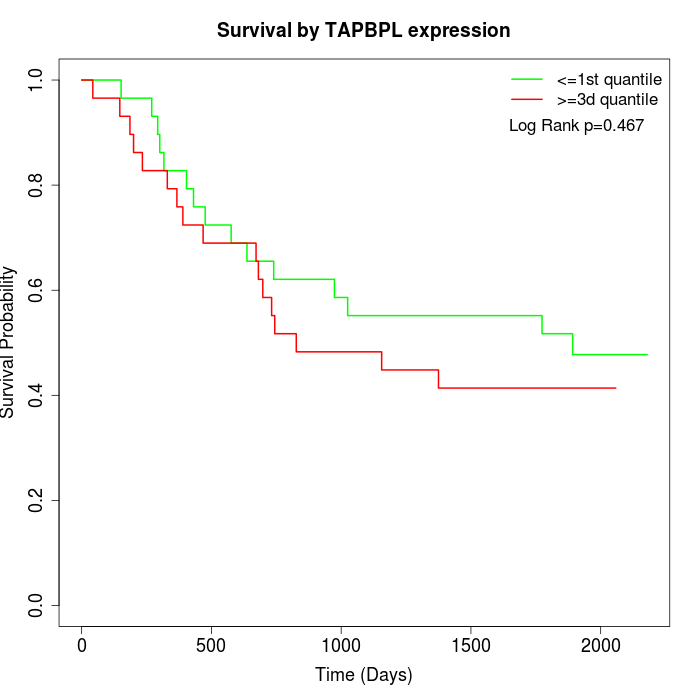 | 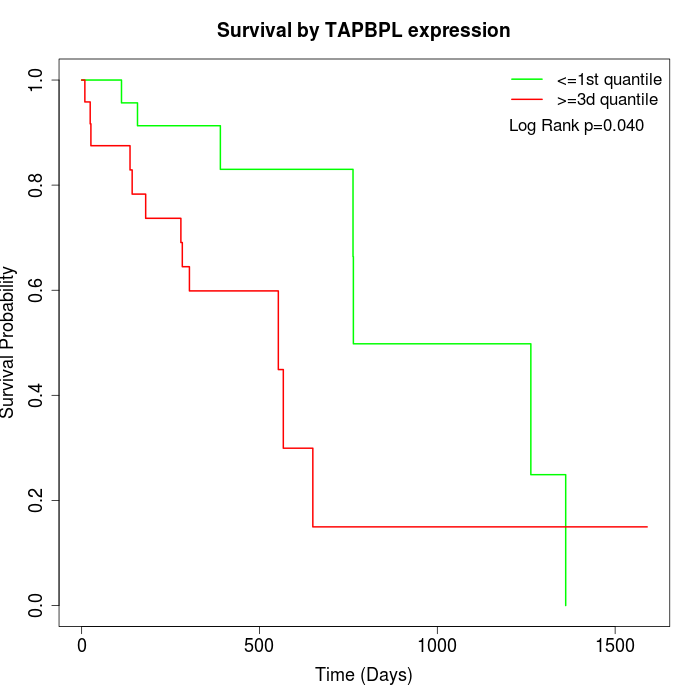 |
| GSE53622 | GSE53624 | TCGA |
Note: Click image to view full size file.
Copy number change of TAPBPL:
| Dataset | Gene | EntrezID | Gain | Loss | Normal | Detail |
|---|---|---|---|---|---|---|
| GSE15526 | TAPBPL | 55080 | 9 | 4 | 17 | |
| GSE20123 | TAPBPL | 55080 | 9 | 4 | 17 | |
| GSE43470 | TAPBPL | 55080 | 8 | 3 | 32 | |
| GSE46452 | TAPBPL | 55080 | 10 | 1 | 48 | |
| GSE47630 | TAPBPL | 55080 | 12 | 2 | 26 | |
| GSE54993 | TAPBPL | 55080 | 1 | 10 | 59 | |
| GSE54994 | TAPBPL | 55080 | 10 | 2 | 41 | |
| GSE60625 | TAPBPL | 55080 | 0 | 1 | 10 | |
| GSE74703 | TAPBPL | 55080 | 7 | 2 | 27 | |
| GSE74704 | TAPBPL | 55080 | 5 | 3 | 12 | |
| TCGA | TAPBPL | 55080 | 40 | 6 | 50 |
Total number of gains: 111; Total number of losses: 38; Total Number of normals: 339.
Somatic mutations of TAPBPL:
Generating mutation plots.
Highly correlated genes for TAPBPL:
Showing top 20/280 corelated genes with mean PCC>0.5.
| Gene1 | Gene2 | Mean PCC | Num. Datasets | Num. PCC<0 | Num. PCC>0.5 |
|---|---|---|---|---|---|
| TAPBPL | ZBED1 | 0.686102 | 3 | 0 | 3 |
| TAPBPL | MAP4K1 | 0.680017 | 3 | 0 | 3 |
| TAPBPL | KCNA3 | 0.634819 | 3 | 0 | 3 |
| TAPBPL | GPX2 | 0.632368 | 3 | 0 | 3 |
| TAPBPL | TP63 | 0.629125 | 3 | 0 | 3 |
| TAPBPL | LSAMP-AS1 | 0.627199 | 3 | 0 | 3 |
| TAPBPL | PKMYT1 | 0.626787 | 4 | 0 | 4 |
| TAPBPL | AZIN2 | 0.624128 | 4 | 0 | 3 |
| TAPBPL | TXNDC12 | 0.620999 | 5 | 0 | 5 |
| TAPBPL | HELZ | 0.617859 | 4 | 0 | 3 |
| TAPBPL | NAT14 | 0.617605 | 4 | 0 | 3 |
| TAPBPL | FUBP1 | 0.616826 | 3 | 0 | 3 |
| TAPBPL | LILRB1 | 0.614053 | 4 | 0 | 3 |
| TAPBPL | SPINT2 | 0.611288 | 3 | 0 | 3 |
| TAPBPL | SUPT5H | 0.609137 | 4 | 0 | 3 |
| TAPBPL | NXPE3 | 0.607644 | 3 | 0 | 3 |
| TAPBPL | CCNK | 0.598144 | 4 | 0 | 4 |
| TAPBPL | RUNX2 | 0.597888 | 5 | 0 | 5 |
| TAPBPL | IL15RA | 0.594309 | 9 | 0 | 8 |
| TAPBPL | BMF | 0.593645 | 5 | 0 | 3 |
For details and further investigation, click here