| Full name: leukocyte immunoglobulin like receptor B1 | Alias Symbol: LIR-1|ILT2|MIR-7|CD85|LIR1|CD85j|PIRB|PIR-B | ||
| Type: protein-coding gene | Cytoband: 19q13.42 | ||
| Entrez ID: 10859 | HGNC ID: HGNC:6605 | Ensembl Gene: ENSG00000104972 | OMIM ID: 604811 |
LILRB1 involved pathways:
| KEGG pathway | Description | View |
|---|---|---|
| hsa04380 | Osteoclast differentiation |
Expression of LILRB1:
| Dataset | Gene | EntrezID | Probe | Log2FC | Adj.pValue | Expression |
|---|---|---|---|---|---|---|
| GSE17351 | LILRB1 | 10859 | 211336_x_at | 0.5160 | 0.2733 | |
| GSE20347 | LILRB1 | 10859 | 211336_x_at | 0.1209 | 0.1518 | |
| GSE23400 | LILRB1 | 10859 | 211336_x_at | 0.0699 | 0.1595 | |
| GSE26886 | LILRB1 | 10859 | 211336_x_at | -0.1511 | 0.2419 | |
| GSE29001 | LILRB1 | 10859 | 211336_x_at | -0.0293 | 0.8876 | |
| GSE38129 | LILRB1 | 10859 | 211336_x_at | 0.0738 | 0.4597 | |
| GSE45670 | LILRB1 | 10859 | 207104_x_at | 0.0875 | 0.4977 | |
| GSE53622 | LILRB1 | 10859 | 70134 | 0.8441 | 0.0001 | |
| GSE53624 | LILRB1 | 10859 | 106485 | 0.4537 | 0.0106 | |
| GSE63941 | LILRB1 | 10859 | 211336_x_at | 0.5167 | 0.0027 | |
| GSE77861 | LILRB1 | 10859 | 211336_x_at | -0.0744 | 0.5028 | |
| GSE97050 | LILRB1 | 10859 | A_33_P3231414 | 1.2412 | 0.1399 | |
| SRP007169 | LILRB1 | 10859 | RNAseq | 3.0001 | 0.0075 | |
| SRP064894 | LILRB1 | 10859 | RNAseq | 1.4801 | 0.0000 | |
| SRP133303 | LILRB1 | 10859 | RNAseq | 0.6625 | 0.0197 | |
| SRP159526 | LILRB1 | 10859 | RNAseq | 0.3614 | 0.6837 | |
| SRP193095 | LILRB1 | 10859 | RNAseq | 0.2388 | 0.3017 | |
| SRP219564 | LILRB1 | 10859 | RNAseq | 1.7227 | 0.0035 | |
| TCGA | LILRB1 | 10859 | RNAseq | 0.3860 | 0.0632 |
Upregulated datasets: 3; Downregulated datasets: 0.
Survival by LILRB1 expression:
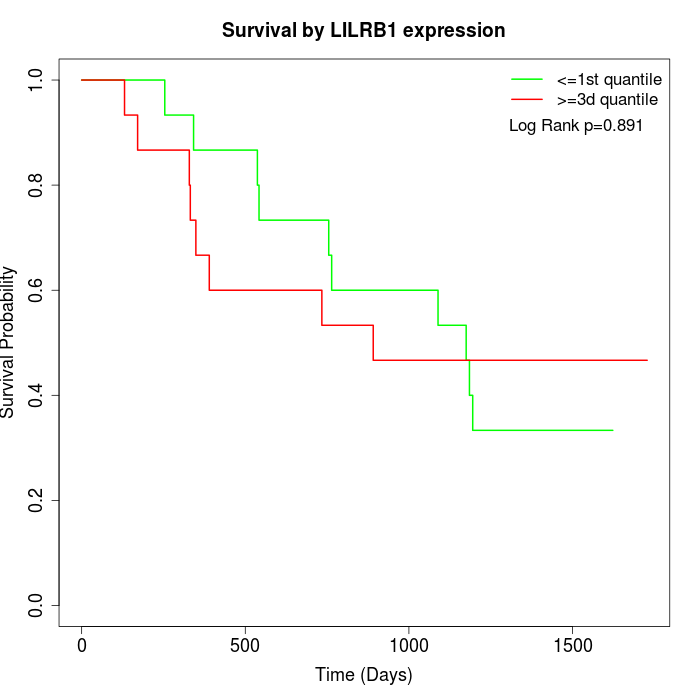 | 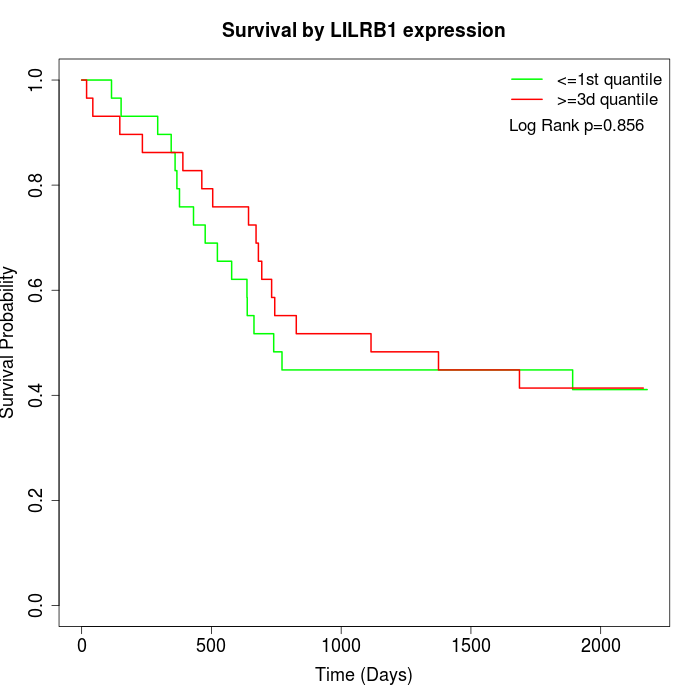 | 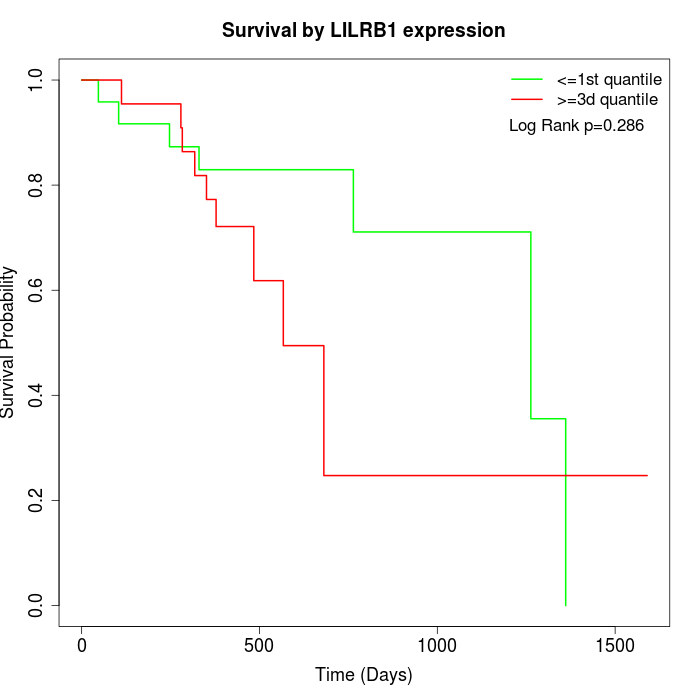 |
| GSE53622 | GSE53624 | TCGA |
Note: Click image to view full size file.
Copy number change of LILRB1:
| Dataset | Gene | EntrezID | Gain | Loss | Normal | Detail |
|---|---|---|---|---|---|---|
| GSE15526 | LILRB1 | 10859 | 3 | 4 | 23 | |
| GSE20123 | LILRB1 | 10859 | 3 | 3 | 24 | |
| GSE43470 | LILRB1 | 10859 | 2 | 11 | 30 | |
| GSE46452 | LILRB1 | 10859 | 45 | 1 | 13 | |
| GSE47630 | LILRB1 | 10859 | 8 | 6 | 26 | |
| GSE54993 | LILRB1 | 10859 | 17 | 4 | 49 | |
| GSE54994 | LILRB1 | 10859 | 4 | 13 | 36 | |
| GSE60625 | LILRB1 | 10859 | 9 | 0 | 2 | |
| GSE74703 | LILRB1 | 10859 | 2 | 7 | 27 | |
| GSE74704 | LILRB1 | 10859 | 3 | 1 | 16 | |
| TCGA | LILRB1 | 10859 | 19 | 14 | 63 |
Total number of gains: 115; Total number of losses: 64; Total Number of normals: 309.
Somatic mutations of LILRB1:
Generating mutation plots.
Highly correlated genes for LILRB1:
Showing top 20/444 corelated genes with mean PCC>0.5.
| Gene1 | Gene2 | Mean PCC | Num. Datasets | Num. PCC<0 | Num. PCC>0.5 |
|---|---|---|---|---|---|
| LILRB1 | PIK3AP1 | 0.852213 | 4 | 0 | 4 |
| LILRB1 | SNAI3 | 0.753049 | 3 | 0 | 3 |
| LILRB1 | DCLRE1C | 0.749369 | 3 | 0 | 3 |
| LILRB1 | IL4I1 | 0.737944 | 5 | 0 | 5 |
| LILRB1 | CERKL | 0.735929 | 3 | 0 | 3 |
| LILRB1 | FBXO6 | 0.734079 | 3 | 0 | 3 |
| LILRB1 | PCED1B | 0.733973 | 3 | 0 | 3 |
| LILRB1 | TIGIT | 0.729148 | 5 | 0 | 4 |
| LILRB1 | LAIR1 | 0.72175 | 10 | 0 | 9 |
| LILRB1 | LILRB4 | 0.717997 | 9 | 0 | 9 |
| LILRB1 | PARVG | 0.714161 | 6 | 0 | 5 |
| LILRB1 | LRRC25 | 0.708715 | 5 | 0 | 4 |
| LILRB1 | CMPK2 | 0.705901 | 3 | 0 | 3 |
| LILRB1 | IKZF1 | 0.703942 | 5 | 0 | 4 |
| LILRB1 | RAC2 | 0.701458 | 5 | 0 | 4 |
| LILRB1 | CXCL16 | 0.70054 | 5 | 0 | 5 |
| LILRB1 | CYTH4 | 0.700356 | 9 | 0 | 7 |
| LILRB1 | RNF213 | 0.698466 | 4 | 0 | 3 |
| LILRB1 | MCM8 | 0.693146 | 3 | 0 | 3 |
| LILRB1 | TNFRSF9 | 0.692718 | 6 | 0 | 6 |
For details and further investigation, click here