| Full name: tumor protein p63 | Alias Symbol: p51|SHFM4|EEC3|p63|p73L|OFC8|KET|p73H|NBP|p53CP | ||
| Type: protein-coding gene | Cytoband: 3q28 | ||
| Entrez ID: 8626 | HGNC ID: HGNC:15979 | Ensembl Gene: ENSG00000073282 | OMIM ID: 603273 |
Screen Evidence:
| |||
Expression of TP63:
| Dataset | Gene | EntrezID | Probe | Log2FC | Adj.pValue | Expression |
|---|---|---|---|---|---|---|
| GSE17351 | TP63 | 8626 | 209863_s_at | 0.8734 | 0.1807 | |
| GSE20347 | TP63 | 8626 | 209863_s_at | 0.9104 | 0.0002 | |
| GSE23400 | TP63 | 8626 | 209863_s_at | 1.4219 | 0.0000 | |
| GSE26886 | TP63 | 8626 | 209863_s_at | 0.7425 | 0.0004 | |
| GSE29001 | TP63 | 8626 | 209863_s_at | 0.7877 | 0.0040 | |
| GSE38129 | TP63 | 8626 | 209863_s_at | 1.9160 | 0.0015 | |
| GSE45670 | TP63 | 8626 | 209863_s_at | 1.1475 | 0.0000 | |
| GSE53622 | TP63 | 8626 | 73095 | 2.0171 | 0.0000 | |
| GSE53624 | TP63 | 8626 | 73095 | 1.3163 | 0.0000 | |
| GSE63941 | TP63 | 8626 | 209863_s_at | 6.2462 | 0.0010 | |
| GSE77861 | TP63 | 8626 | 209863_s_at | 0.9194 | 0.0056 | |
| GSE97050 | TP63 | 8626 | A_24_P273756 | 2.6483 | 0.1403 | |
| SRP007169 | TP63 | 8626 | RNAseq | 1.9299 | 0.0000 | |
| SRP008496 | TP63 | 8626 | RNAseq | 2.0791 | 0.0000 | |
| SRP064894 | TP63 | 8626 | RNAseq | 1.2274 | 0.0081 | |
| SRP133303 | TP63 | 8626 | RNAseq | 1.4346 | 0.0000 | |
| SRP159526 | TP63 | 8626 | RNAseq | 1.5289 | 0.0060 | |
| SRP193095 | TP63 | 8626 | RNAseq | 1.3780 | 0.0045 | |
| SRP219564 | TP63 | 8626 | RNAseq | 0.1449 | 0.8891 | |
| TCGA | TP63 | 8626 | RNAseq | 1.6017 | 0.0000 |
Upregulated datasets: 13; Downregulated datasets: 0.
Survival by TP63 expression:
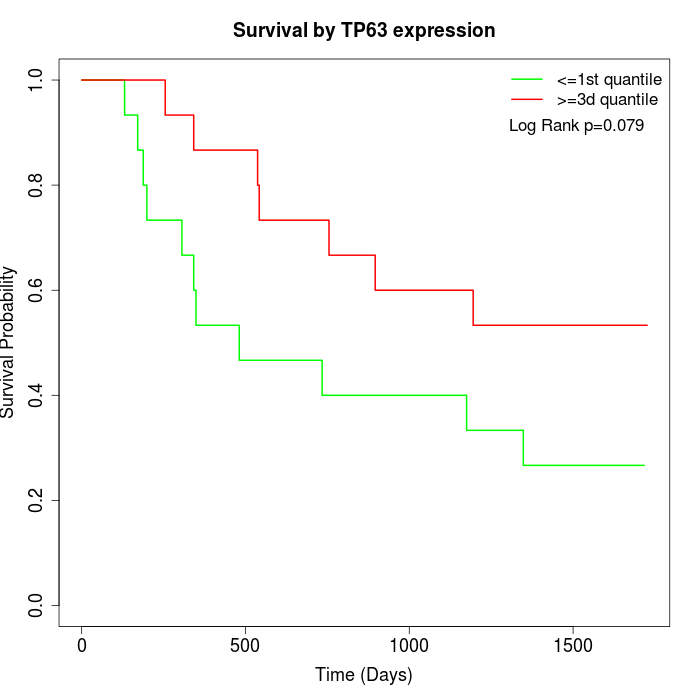 | 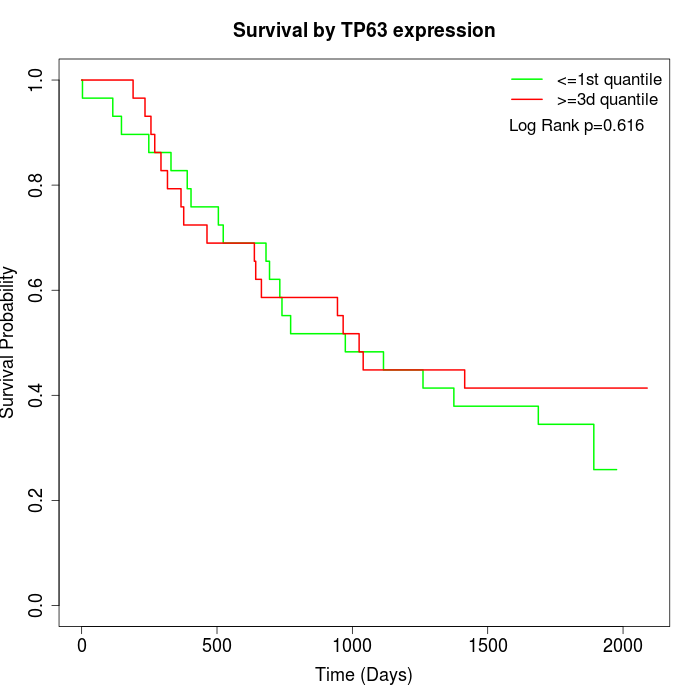 | 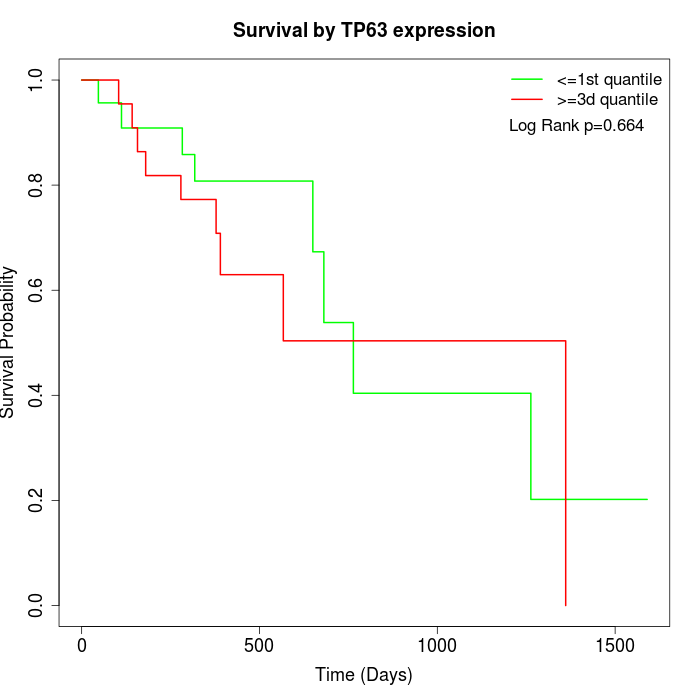 |
| GSE53622 | GSE53624 | TCGA |
Note: Click image to view full size file.
Copy number change of TP63:
| Dataset | Gene | EntrezID | Gain | Loss | Normal | Detail |
|---|---|---|---|---|---|---|
| GSE15526 | TP63 | 8626 | 25 | 0 | 5 | |
| GSE20123 | TP63 | 8626 | 25 | 0 | 5 | |
| GSE43470 | TP63 | 8626 | 23 | 0 | 20 | |
| GSE46452 | TP63 | 8626 | 19 | 1 | 39 | |
| GSE47630 | TP63 | 8626 | 27 | 2 | 11 | |
| GSE54993 | TP63 | 8626 | 1 | 19 | 50 | |
| GSE54994 | TP63 | 8626 | 40 | 0 | 13 | |
| GSE60625 | TP63 | 8626 | 0 | 6 | 5 | |
| GSE74703 | TP63 | 8626 | 20 | 0 | 16 | |
| GSE74704 | TP63 | 8626 | 17 | 0 | 3 | |
| TCGA | TP63 | 8626 | 77 | 0 | 19 |
Total number of gains: 274; Total number of losses: 28; Total Number of normals: 186.
Somatic mutations of TP63:
Generating mutation plots.
Highly correlated genes for TP63:
Showing top 20/1171 corelated genes with mean PCC>0.5.
| Gene1 | Gene2 | Mean PCC | Num. Datasets | Num. PCC<0 | Num. PCC>0.5 |
|---|---|---|---|---|---|
| TP63 | KRT17 | 0.752087 | 4 | 0 | 3 |
| TP63 | IRF6 | 0.74395 | 9 | 0 | 9 |
| TP63 | COMMD2 | 0.729984 | 4 | 0 | 3 |
| TP63 | PDPR | 0.723332 | 3 | 0 | 3 |
| TP63 | FERMT1 | 0.721191 | 12 | 0 | 11 |
| TP63 | UHRF1 | 0.719103 | 6 | 0 | 6 |
| TP63 | CBLC | 0.717782 | 3 | 0 | 3 |
| TP63 | LAMB3 | 0.707868 | 12 | 0 | 11 |
| TP63 | F11R | 0.707277 | 10 | 0 | 10 |
| TP63 | SDCCAG8 | 0.705283 | 4 | 0 | 4 |
| TP63 | CDK1 | 0.700657 | 11 | 0 | 11 |
| TP63 | FANCD2 | 0.700311 | 5 | 0 | 5 |
| TP63 | PPP1R14C | 0.698813 | 7 | 0 | 7 |
| TP63 | ATP1B3 | 0.695692 | 13 | 0 | 11 |
| TP63 | ACTL6A | 0.695393 | 11 | 0 | 11 |
| TP63 | MRPL47 | 0.69398 | 7 | 0 | 7 |
| TP63 | ECT2 | 0.693921 | 11 | 0 | 11 |
| TP63 | TRAF7 | 0.691257 | 5 | 0 | 4 |
| TP63 | SLC7A5 | 0.690194 | 11 | 0 | 10 |
| TP63 | AURKB | 0.686632 | 11 | 0 | 11 |
For details and further investigation, click here