| Full name: protein kinase, membrane associated tyrosine/threonine 1 | Alias Symbol: MYT1|PPP1R126 | ||
| Type: protein-coding gene | Cytoband: 16p13.3 | ||
| Entrez ID: 9088 | HGNC ID: HGNC:29650 | Ensembl Gene: ENSG00000127564 | OMIM ID: 602474 |
Screen Evidence:
| |||
PKMYT1 involved pathways:
| KEGG pathway | Description | View |
|---|---|---|
| hsa04110 | Cell cycle | |
| hsa04114 | Oocyte meiosis | |
| hsa04914 | Progesterone-mediated oocyte maturation |
Expression of PKMYT1:
| Dataset | Gene | EntrezID | Probe | Log2FC | Adj.pValue | Expression |
|---|---|---|---|---|---|---|
| GSE17351 | PKMYT1 | 9088 | 204267_x_at | 0.7572 | 0.0605 | |
| GSE20347 | PKMYT1 | 9088 | 204267_x_at | 0.4422 | 0.0000 | |
| GSE23400 | PKMYT1 | 9088 | 204267_x_at | 0.3774 | 0.0000 | |
| GSE26886 | PKMYT1 | 9088 | 204267_x_at | 0.3668 | 0.0176 | |
| GSE29001 | PKMYT1 | 9088 | 204267_x_at | 0.4530 | 0.0522 | |
| GSE38129 | PKMYT1 | 9088 | 204267_x_at | 0.5816 | 0.0000 | |
| GSE45670 | PKMYT1 | 9088 | 204267_x_at | 0.5351 | 0.0002 | |
| GSE63941 | PKMYT1 | 9088 | 204267_x_at | 1.4397 | 0.0000 | |
| GSE77861 | PKMYT1 | 9088 | 204267_x_at | 0.2651 | 0.0501 | |
| GSE97050 | PKMYT1 | 9088 | A_33_P3397443 | 0.7160 | 0.2229 | |
| SRP007169 | PKMYT1 | 9088 | RNAseq | 1.9285 | 0.0087 | |
| SRP064894 | PKMYT1 | 9088 | RNAseq | 1.9401 | 0.0000 | |
| SRP133303 | PKMYT1 | 9088 | RNAseq | 1.8539 | 0.0000 | |
| SRP159526 | PKMYT1 | 9088 | RNAseq | 1.7560 | 0.0001 | |
| SRP193095 | PKMYT1 | 9088 | RNAseq | 1.7391 | 0.0000 | |
| SRP219564 | PKMYT1 | 9088 | RNAseq | 2.6590 | 0.0013 | |
| TCGA | PKMYT1 | 9088 | RNAseq | 1.4576 | 0.0000 |
Upregulated datasets: 8; Downregulated datasets: 0.
Survival by PKMYT1 expression:
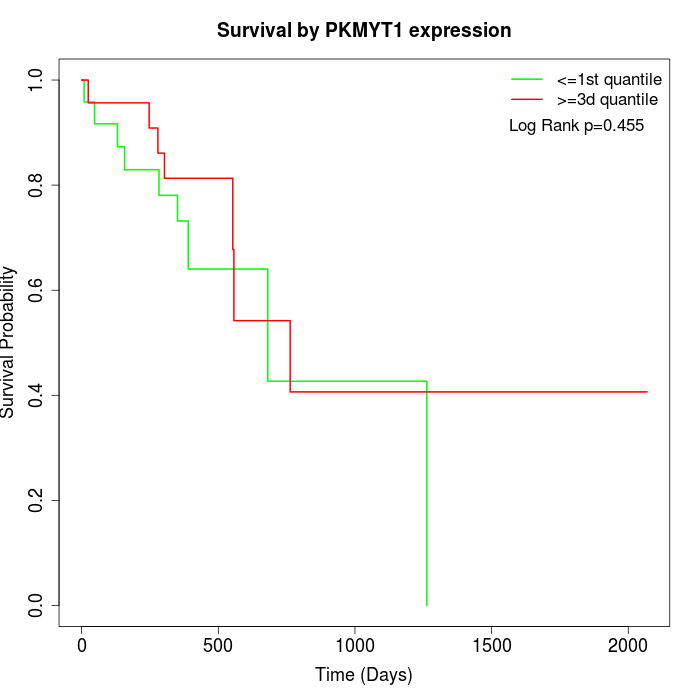 |
| TCGA |
Note: Click image to view full size file.
Copy number change of PKMYT1:
| Dataset | Gene | EntrezID | Gain | Loss | Normal | Detail |
|---|---|---|---|---|---|---|
| GSE15526 | PKMYT1 | 9088 | 5 | 5 | 20 | |
| GSE20123 | PKMYT1 | 9088 | 5 | 4 | 21 | |
| GSE43470 | PKMYT1 | 9088 | 4 | 7 | 32 | |
| GSE46452 | PKMYT1 | 9088 | 38 | 1 | 20 | |
| GSE47630 | PKMYT1 | 9088 | 13 | 6 | 21 | |
| GSE54993 | PKMYT1 | 9088 | 3 | 5 | 62 | |
| GSE54994 | PKMYT1 | 9088 | 5 | 9 | 39 | |
| GSE60625 | PKMYT1 | 9088 | 4 | 0 | 7 | |
| GSE74703 | PKMYT1 | 9088 | 4 | 5 | 27 | |
| GSE74704 | PKMYT1 | 9088 | 3 | 2 | 15 | |
| TCGA | PKMYT1 | 9088 | 19 | 13 | 64 |
Total number of gains: 103; Total number of losses: 57; Total Number of normals: 328.
Somatic mutations of PKMYT1:
Generating mutation plots.
Highly correlated genes for PKMYT1:
Showing top 20/1346 corelated genes with mean PCC>0.5.
| Gene1 | Gene2 | Mean PCC | Num. Datasets | Num. PCC<0 | Num. PCC>0.5 |
|---|---|---|---|---|---|
| PKMYT1 | MTFR2 | 0.774645 | 5 | 0 | 5 |
| PKMYT1 | PSMG3 | 0.772102 | 4 | 0 | 4 |
| PKMYT1 | MYBL2 | 0.769265 | 10 | 0 | 10 |
| PKMYT1 | ZGRF1 | 0.758558 | 3 | 0 | 3 |
| PKMYT1 | PLK1 | 0.751049 | 9 | 0 | 8 |
| PKMYT1 | TRIP13 | 0.746146 | 10 | 0 | 10 |
| PKMYT1 | UHRF1 | 0.74326 | 6 | 0 | 6 |
| PKMYT1 | CDT1 | 0.741526 | 9 | 0 | 9 |
| PKMYT1 | CDCA5 | 0.73964 | 6 | 0 | 6 |
| PKMYT1 | UBE2T | 0.738523 | 6 | 0 | 6 |
| PKMYT1 | AUNIP | 0.738515 | 9 | 0 | 9 |
| PKMYT1 | TROAP | 0.737145 | 10 | 0 | 10 |
| PKMYT1 | KIFC1 | 0.736209 | 10 | 0 | 10 |
| PKMYT1 | KNSTRN | 0.735021 | 5 | 0 | 5 |
| PKMYT1 | NDE1 | 0.733273 | 9 | 0 | 9 |
| PKMYT1 | GINS4 | 0.72856 | 7 | 0 | 7 |
| PKMYT1 | CENPN | 0.726133 | 9 | 0 | 9 |
| PKMYT1 | STIL | 0.721955 | 9 | 0 | 8 |
| PKMYT1 | CENPW | 0.72108 | 6 | 0 | 5 |
| PKMYT1 | CKAP2L | 0.720723 | 6 | 0 | 5 |
For details and further investigation, click here