| Full name: transmembrane anterior posterior transformation 1 | Alias Symbol: FLJ90013 | ||
| Type: protein-coding gene | Cytoband: 4p15.32 | ||
| Entrez ID: 202018 | HGNC ID: HGNC:26887 | Ensembl Gene: ENSG00000169762 | OMIM ID: 612758 |
Screen Evidence:
| |||
Expression of TAPT1:
| Dataset | Gene | EntrezID | Probe | Log2FC | Adj.pValue | Expression |
|---|---|---|---|---|---|---|
| GSE17351 | TAPT1 | 202018 | 227407_at | -0.0830 | 0.9076 | |
| GSE20347 | TAPT1 | 202018 | 216507_at | -0.1054 | 0.1510 | |
| GSE23400 | TAPT1 | 202018 | 216507_at | -0.1379 | 0.0018 | |
| GSE26886 | TAPT1 | 202018 | 227407_at | -0.7694 | 0.0086 | |
| GSE29001 | TAPT1 | 202018 | 216507_at | -0.1798 | 0.2716 | |
| GSE38129 | TAPT1 | 202018 | 216507_at | -0.2055 | 0.0206 | |
| GSE45670 | TAPT1 | 202018 | 227407_at | -0.4583 | 0.0031 | |
| GSE53622 | TAPT1 | 202018 | 23018 | -0.5094 | 0.0000 | |
| GSE53624 | TAPT1 | 202018 | 23018 | -0.5228 | 0.0000 | |
| GSE63941 | TAPT1 | 202018 | 227407_at | -1.5629 | 0.0034 | |
| GSE77861 | TAPT1 | 202018 | 226735_at | -0.3013 | 0.0322 | |
| GSE97050 | TAPT1 | 202018 | A_33_P3306177 | -0.1532 | 0.6519 | |
| SRP007169 | TAPT1 | 202018 | RNAseq | -0.4115 | 0.4404 | |
| SRP008496 | TAPT1 | 202018 | RNAseq | -0.2616 | 0.4252 | |
| SRP064894 | TAPT1 | 202018 | RNAseq | -0.4948 | 0.0018 | |
| SRP133303 | TAPT1 | 202018 | RNAseq | -0.3200 | 0.0305 | |
| SRP159526 | TAPT1 | 202018 | RNAseq | -0.1941 | 0.4797 | |
| SRP193095 | TAPT1 | 202018 | RNAseq | -0.5760 | 0.0000 | |
| SRP219564 | TAPT1 | 202018 | RNAseq | -0.2967 | 0.3460 | |
| TCGA | TAPT1 | 202018 | RNAseq | -0.3805 | 0.0000 |
Upregulated datasets: 0; Downregulated datasets: 1.
Survival by TAPT1 expression:
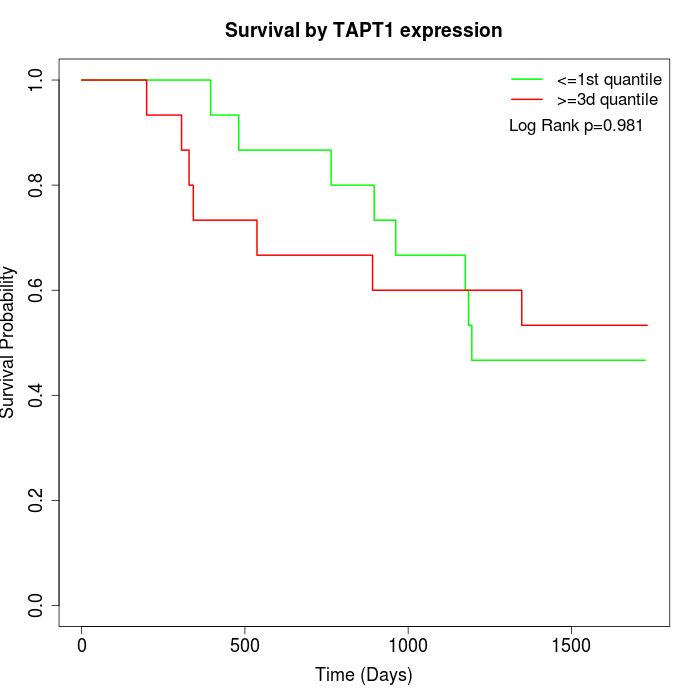 | 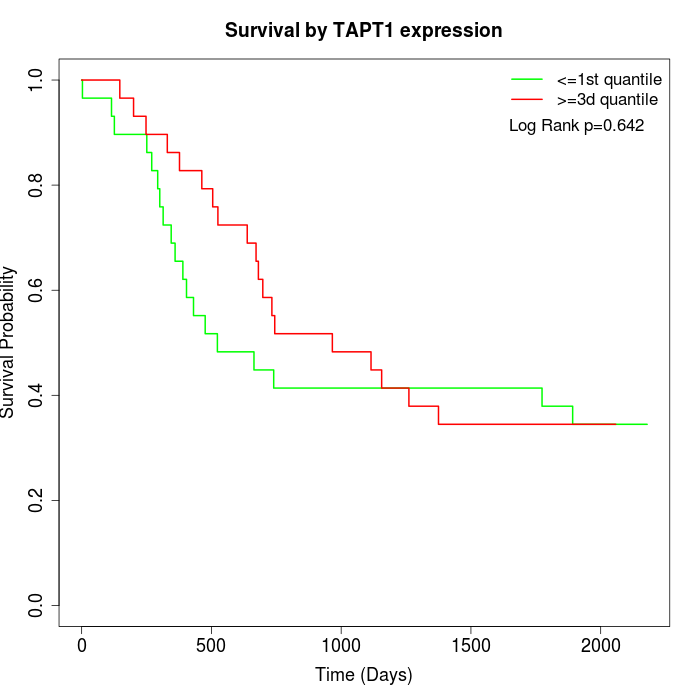 | 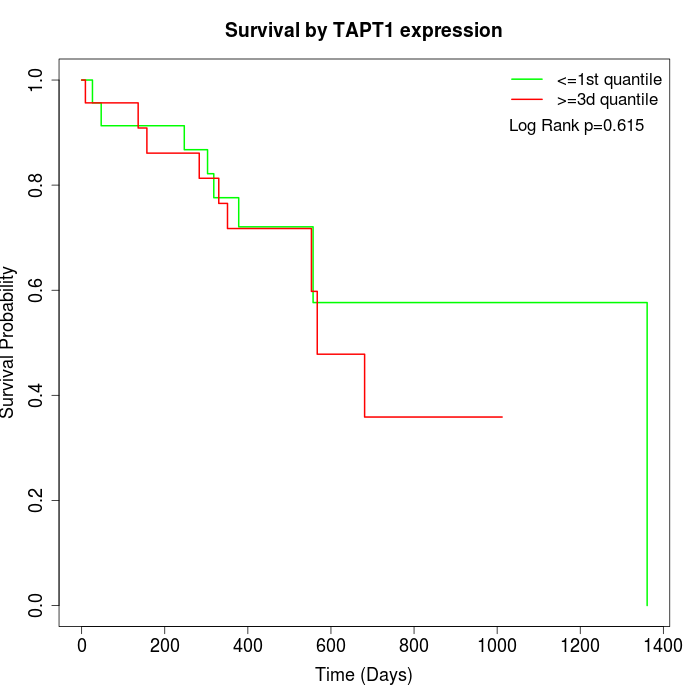 |
| GSE53622 | GSE53624 | TCGA |
Note: Click image to view full size file.
Copy number change of TAPT1:
| Dataset | Gene | EntrezID | Gain | Loss | Normal | Detail |
|---|---|---|---|---|---|---|
| GSE15526 | TAPT1 | 202018 | 0 | 18 | 12 | |
| GSE20123 | TAPT1 | 202018 | 0 | 18 | 12 | |
| GSE43470 | TAPT1 | 202018 | 1 | 15 | 27 | |
| GSE46452 | TAPT1 | 202018 | 1 | 36 | 22 | |
| GSE47630 | TAPT1 | 202018 | 1 | 19 | 20 | |
| GSE54993 | TAPT1 | 202018 | 10 | 0 | 60 | |
| GSE54994 | TAPT1 | 202018 | 4 | 12 | 37 | |
| GSE60625 | TAPT1 | 202018 | 0 | 0 | 11 | |
| GSE74703 | TAPT1 | 202018 | 1 | 13 | 22 | |
| GSE74704 | TAPT1 | 202018 | 0 | 11 | 9 | |
| TCGA | TAPT1 | 202018 | 9 | 48 | 39 |
Total number of gains: 27; Total number of losses: 190; Total Number of normals: 271.
Somatic mutations of TAPT1:
Generating mutation plots.
Highly correlated genes for TAPT1:
Showing top 20/490 corelated genes with mean PCC>0.5.
| Gene1 | Gene2 | Mean PCC | Num. Datasets | Num. PCC<0 | Num. PCC>0.5 |
|---|---|---|---|---|---|
| TAPT1 | PHLDB1 | 0.705154 | 5 | 0 | 4 |
| TAPT1 | G6PC2 | 0.703709 | 4 | 0 | 4 |
| TAPT1 | SLC13A3 | 0.701053 | 4 | 0 | 4 |
| TAPT1 | FGF23 | 0.696854 | 5 | 0 | 5 |
| TAPT1 | ACRV1 | 0.684427 | 6 | 0 | 6 |
| TAPT1 | TUBB4A | 0.679464 | 6 | 0 | 6 |
| TAPT1 | NPAP1 | 0.67605 | 4 | 0 | 4 |
| TAPT1 | MAP3K19 | 0.670274 | 5 | 0 | 5 |
| TAPT1 | PDE6H | 0.665775 | 4 | 0 | 4 |
| TAPT1 | PIWIL2 | 0.664974 | 4 | 0 | 4 |
| TAPT1 | KCNMB2 | 0.662952 | 4 | 0 | 3 |
| TAPT1 | NDST4 | 0.662756 | 3 | 0 | 3 |
| TAPT1 | EPS8L3 | 0.662055 | 5 | 0 | 4 |
| TAPT1 | PKNOX2 | 0.66184 | 5 | 0 | 5 |
| TAPT1 | MORN1 | 0.660518 | 5 | 0 | 4 |
| TAPT1 | GRIN1 | 0.657521 | 5 | 0 | 4 |
| TAPT1 | COLEC10 | 0.657349 | 5 | 0 | 5 |
| TAPT1 | OR10J1 | 0.656496 | 4 | 0 | 3 |
| TAPT1 | PCCA | 0.655978 | 6 | 0 | 6 |
| TAPT1 | ATF7 | 0.654701 | 5 | 0 | 4 |
For details and further investigation, click here