| Full name: TBC1 domain family member 9 | Alias Symbol: KIAA0882|MDR1|GRAMD9 | ||
| Type: protein-coding gene | Cytoband: 4q31.21 | ||
| Entrez ID: 23158 | HGNC ID: HGNC:21710 | Ensembl Gene: ENSG00000109436 | OMIM ID: 618035 |
Expression of TBC1D9:
| Dataset | Gene | EntrezID | Probe | Log2FC | Adj.pValue | Expression |
|---|---|---|---|---|---|---|
| GSE17351 | TBC1D9 | 23158 | 212956_at | -0.0189 | 0.9860 | |
| GSE20347 | TBC1D9 | 23158 | 212956_at | -0.0387 | 0.8762 | |
| GSE23400 | TBC1D9 | 23158 | 212956_at | 0.0429 | 0.7412 | |
| GSE26886 | TBC1D9 | 23158 | 212956_at | -0.0769 | 0.8718 | |
| GSE29001 | TBC1D9 | 23158 | 212956_at | -0.1540 | 0.7657 | |
| GSE38129 | TBC1D9 | 23158 | 212956_at | -0.2748 | 0.1447 | |
| GSE45670 | TBC1D9 | 23158 | 212956_at | -0.2987 | 0.2047 | |
| GSE53622 | TBC1D9 | 23158 | 128058 | -0.1066 | 0.2505 | |
| GSE53624 | TBC1D9 | 23158 | 128058 | -0.3987 | 0.0018 | |
| GSE63941 | TBC1D9 | 23158 | 212956_at | -1.7919 | 0.0150 | |
| GSE77861 | TBC1D9 | 23158 | 212956_at | 0.1738 | 0.7131 | |
| GSE97050 | TBC1D9 | 23158 | A_23_P41487 | 0.2549 | 0.4550 | |
| SRP007169 | TBC1D9 | 23158 | RNAseq | -0.2327 | 0.6532 | |
| SRP008496 | TBC1D9 | 23158 | RNAseq | -0.3566 | 0.2227 | |
| SRP064894 | TBC1D9 | 23158 | RNAseq | -0.1310 | 0.5279 | |
| SRP133303 | TBC1D9 | 23158 | RNAseq | 0.0686 | 0.6215 | |
| SRP159526 | TBC1D9 | 23158 | RNAseq | 0.1845 | 0.6682 | |
| SRP193095 | TBC1D9 | 23158 | RNAseq | -0.1526 | 0.3137 | |
| SRP219564 | TBC1D9 | 23158 | RNAseq | -0.1232 | 0.7134 | |
| TCGA | TBC1D9 | 23158 | RNAseq | -0.3921 | 0.0000 |
Upregulated datasets: 0; Downregulated datasets: 1.
Survival by TBC1D9 expression:
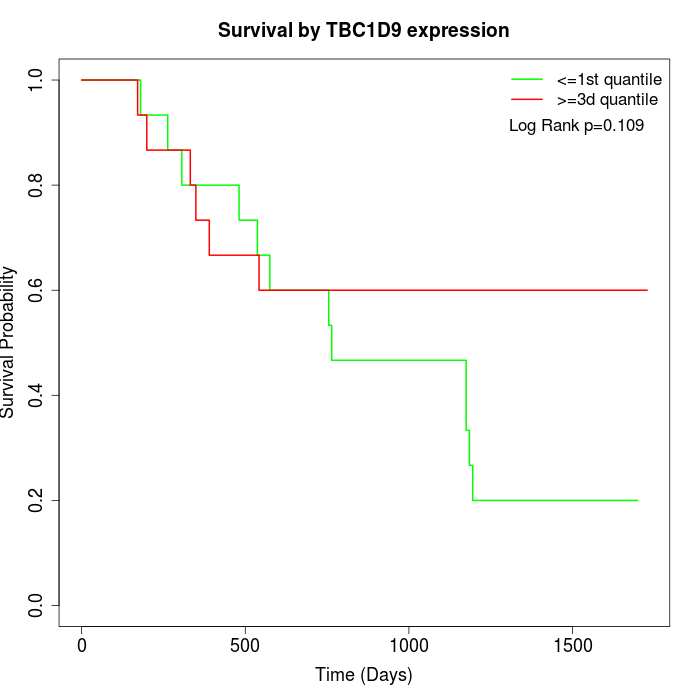 |  |  |
| GSE53622 | GSE53624 | TCGA |
Note: Click image to view full size file.
Copy number change of TBC1D9:
| Dataset | Gene | EntrezID | Gain | Loss | Normal | Detail |
|---|---|---|---|---|---|---|
| GSE15526 | TBC1D9 | 23158 | 0 | 12 | 18 | |
| GSE20123 | TBC1D9 | 23158 | 0 | 12 | 18 | |
| GSE43470 | TBC1D9 | 23158 | 0 | 13 | 30 | |
| GSE46452 | TBC1D9 | 23158 | 1 | 36 | 22 | |
| GSE47630 | TBC1D9 | 23158 | 0 | 22 | 18 | |
| GSE54993 | TBC1D9 | 23158 | 10 | 0 | 60 | |
| GSE54994 | TBC1D9 | 23158 | 2 | 11 | 40 | |
| GSE60625 | TBC1D9 | 23158 | 0 | 1 | 10 | |
| GSE74703 | TBC1D9 | 23158 | 0 | 11 | 25 | |
| GSE74704 | TBC1D9 | 23158 | 0 | 6 | 14 | |
| TCGA | TBC1D9 | 23158 | 12 | 31 | 53 |
Total number of gains: 25; Total number of losses: 155; Total Number of normals: 308.
Somatic mutations of TBC1D9:
Generating mutation plots.
Highly correlated genes for TBC1D9:
Showing top 20/32 corelated genes with mean PCC>0.5.
| Gene1 | Gene2 | Mean PCC | Num. Datasets | Num. PCC<0 | Num. PCC>0.5 |
|---|---|---|---|---|---|
| TBC1D9 | CYB5R4 | 0.659176 | 4 | 0 | 4 |
| TBC1D9 | LAYN | 0.626347 | 4 | 0 | 3 |
| TBC1D9 | MID1 | 0.615637 | 4 | 0 | 3 |
| TBC1D9 | IL10RA | 0.615136 | 5 | 0 | 4 |
| TBC1D9 | IKBKB | 0.614392 | 6 | 0 | 5 |
| TBC1D9 | CD3G | 0.6133 | 4 | 0 | 3 |
| TBC1D9 | CORO1A | 0.592627 | 3 | 0 | 3 |
| TBC1D9 | SCN9A | 0.586094 | 4 | 0 | 3 |
| TBC1D9 | TMEM176B | 0.585547 | 4 | 0 | 3 |
| TBC1D9 | POC1B | 0.57744 | 5 | 0 | 3 |
| TBC1D9 | GALNT5 | 0.577087 | 4 | 0 | 3 |
| TBC1D9 | SEMA5A | 0.576558 | 4 | 0 | 3 |
| TBC1D9 | FUT10 | 0.575645 | 3 | 0 | 3 |
| TBC1D9 | CPQ | 0.566904 | 3 | 0 | 3 |
| TBC1D9 | EPHX4 | 0.559889 | 4 | 0 | 3 |
| TBC1D9 | PIR | 0.554293 | 3 | 0 | 3 |
| TBC1D9 | MFSD1 | 0.553955 | 6 | 0 | 4 |
| TBC1D9 | ICAM3 | 0.550664 | 4 | 0 | 3 |
| TBC1D9 | CD48 | 0.538079 | 7 | 0 | 4 |
| TBC1D9 | CD52 | 0.530511 | 6 | 0 | 3 |
For details and further investigation, click here