| Full name: transferrin receptor 2 | Alias Symbol: HFE3|TFRC2 | ||
| Type: protein-coding gene | Cytoband: 7q22.1 | ||
| Entrez ID: 7036 | HGNC ID: HGNC:11762 | Ensembl Gene: ENSG00000106327 | OMIM ID: 604720 |
Expression of TFR2:
| Dataset | Gene | EntrezID | Probe | Log2FC | Adj.pValue | Expression |
|---|---|---|---|---|---|---|
| GSE17351 | TFR2 | 7036 | 210215_at | 0.7444 | 0.0464 | |
| GSE20347 | TFR2 | 7036 | 215863_at | 0.2160 | 0.0188 | |
| GSE23400 | TFR2 | 7036 | 215863_at | -0.0808 | 0.0901 | |
| GSE26886 | TFR2 | 7036 | 215863_at | 0.3475 | 0.0286 | |
| GSE29001 | TFR2 | 7036 | 210215_at | 0.0618 | 0.8665 | |
| GSE38129 | TFR2 | 7036 | 215863_at | 0.0066 | 0.9646 | |
| GSE45670 | TFR2 | 7036 | 215863_at | 0.1556 | 0.0344 | |
| GSE53622 | TFR2 | 7036 | 12961 | 0.4107 | 0.0167 | |
| GSE53624 | TFR2 | 7036 | 12961 | 0.2096 | 0.0244 | |
| GSE63941 | TFR2 | 7036 | 210215_at | 0.7289 | 0.1126 | |
| GSE77861 | TFR2 | 7036 | 215863_at | -0.0109 | 0.9532 | |
| GSE97050 | TFR2 | 7036 | A_23_P122896 | 0.2851 | 0.2593 | |
| SRP133303 | TFR2 | 7036 | RNAseq | 0.4031 | 0.2675 | |
| SRP159526 | TFR2 | 7036 | RNAseq | 1.3589 | 0.0137 | |
| SRP219564 | TFR2 | 7036 | RNAseq | 0.8172 | 0.1448 | |
| TCGA | TFR2 | 7036 | RNAseq | -1.1419 | 0.0001 |
Upregulated datasets: 1; Downregulated datasets: 1.
Survival by TFR2 expression:
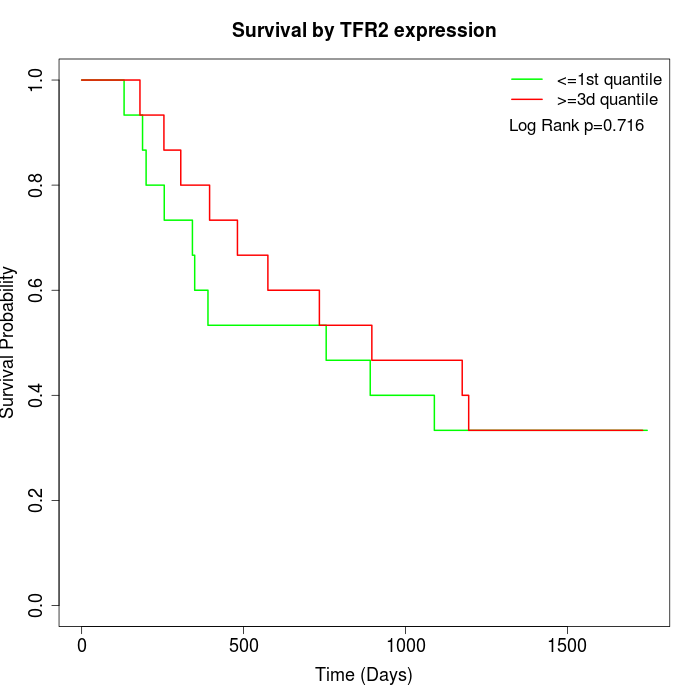 | 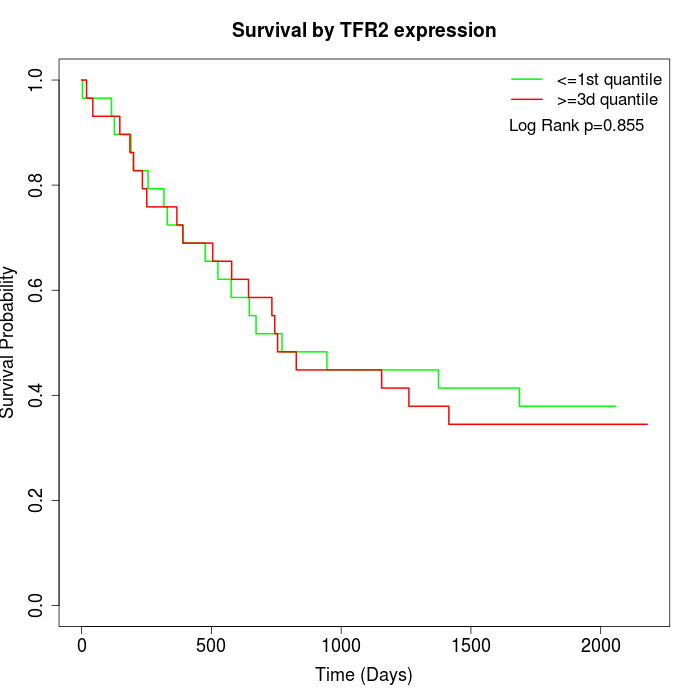 | 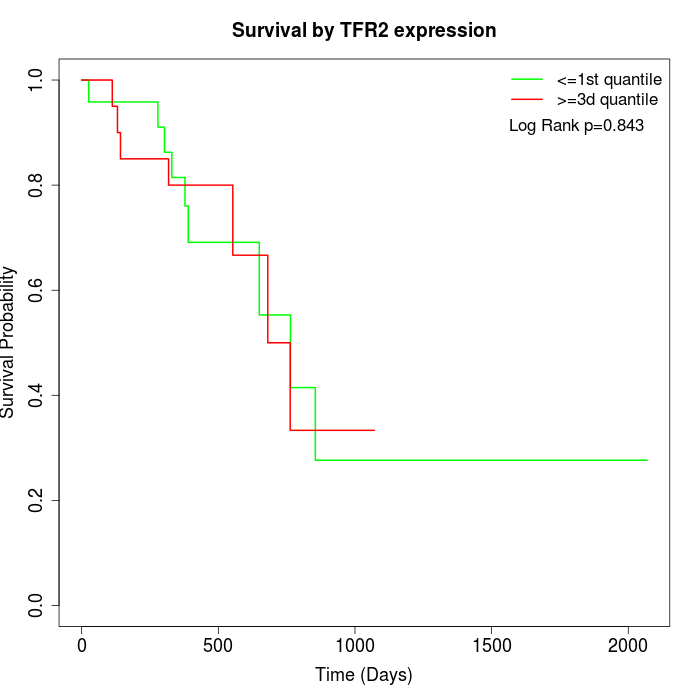 |
| GSE53622 | GSE53624 | TCGA |
Note: Click image to view full size file.
Copy number change of TFR2:
| Dataset | Gene | EntrezID | Gain | Loss | Normal | Detail |
|---|---|---|---|---|---|---|
| GSE15526 | TFR2 | 7036 | 13 | 0 | 17 | |
| GSE20123 | TFR2 | 7036 | 13 | 0 | 17 | |
| GSE43470 | TFR2 | 7036 | 7 | 2 | 34 | |
| GSE46452 | TFR2 | 7036 | 11 | 1 | 47 | |
| GSE47630 | TFR2 | 7036 | 7 | 3 | 30 | |
| GSE54993 | TFR2 | 7036 | 1 | 9 | 60 | |
| GSE54994 | TFR2 | 7036 | 16 | 3 | 34 | |
| GSE60625 | TFR2 | 7036 | 0 | 0 | 11 | |
| GSE74703 | TFR2 | 7036 | 7 | 1 | 28 | |
| GSE74704 | TFR2 | 7036 | 9 | 0 | 11 | |
| TCGA | TFR2 | 7036 | 53 | 6 | 37 |
Total number of gains: 137; Total number of losses: 25; Total Number of normals: 326.
Somatic mutations of TFR2:
Generating mutation plots.
Highly correlated genes for TFR2:
Showing top 20/461 corelated genes with mean PCC>0.5.
| Gene1 | Gene2 | Mean PCC | Num. Datasets | Num. PCC<0 | Num. PCC>0.5 |
|---|---|---|---|---|---|
| TFR2 | CBS | 0.814812 | 3 | 0 | 3 |
| TFR2 | MIEF1 | 0.722811 | 3 | 0 | 3 |
| TFR2 | ZNF628 | 0.721432 | 3 | 0 | 3 |
| TFR2 | MAP2K7 | 0.714368 | 6 | 0 | 5 |
| TFR2 | GAS6-AS1 | 0.710342 | 3 | 0 | 3 |
| TFR2 | BRPF1 | 0.706892 | 3 | 0 | 3 |
| TFR2 | NOP14 | 0.703421 | 3 | 0 | 3 |
| TFR2 | PRKD2 | 0.689102 | 3 | 0 | 3 |
| TFR2 | FBXO44 | 0.679834 | 3 | 0 | 3 |
| TFR2 | LYG2 | 0.674664 | 3 | 0 | 3 |
| TFR2 | FZR1 | 0.673352 | 4 | 0 | 4 |
| TFR2 | IGSF8 | 0.672375 | 3 | 0 | 3 |
| TFR2 | NPTX1 | 0.668054 | 3 | 0 | 3 |
| TFR2 | MBD6 | 0.663883 | 3 | 0 | 3 |
| TFR2 | TMEM238 | 0.662256 | 3 | 0 | 3 |
| TFR2 | TRPC4 | 0.659979 | 4 | 0 | 4 |
| TFR2 | CCDC40 | 0.656829 | 4 | 0 | 3 |
| TFR2 | IRF4 | 0.652147 | 3 | 0 | 3 |
| TFR2 | CPSF4 | 0.651697 | 5 | 0 | 5 |
| TFR2 | PRSS21 | 0.650849 | 3 | 0 | 3 |
For details and further investigation, click here