| Full name: thrombospondin 2 | Alias Symbol: TSP2 | ||
| Type: protein-coding gene | Cytoband: 6q27 | ||
| Entrez ID: 7058 | HGNC ID: HGNC:11786 | Ensembl Gene: ENSG00000186340 | OMIM ID: 188061 |
| Related drugs: BEVACIZUMAB, CORTICOTROPIN... [more] | |||
THBS2 involved pathways:
| KEGG pathway | Description | View |
|---|---|---|
| hsa04151 | PI3K-Akt signaling pathway | |
| hsa04510 | Focal adhesion |
Expression of THBS2:
| Dataset | Gene | EntrezID | Probe | Log2FC | Adj.pValue | Expression |
|---|---|---|---|---|---|---|
| GSE17351 | THBS2 | 7058 | 203083_at | 0.9795 | 0.3559 | |
| GSE20347 | THBS2 | 7058 | 203083_at | 2.1015 | 0.0000 | |
| GSE23400 | THBS2 | 7058 | 203083_at | 1.5389 | 0.0000 | |
| GSE26886 | THBS2 | 7058 | 203083_at | 2.2213 | 0.0009 | |
| GSE29001 | THBS2 | 7058 | 203083_at | 1.4271 | 0.0062 | |
| GSE38129 | THBS2 | 7058 | 203083_at | 2.1108 | 0.0000 | |
| GSE45670 | THBS2 | 7058 | 203083_at | 0.4238 | 0.4941 | |
| GSE53622 | THBS2 | 7058 | 39207 | 2.3956 | 0.0000 | |
| GSE53624 | THBS2 | 7058 | 23618 | 1.7049 | 0.0000 | |
| GSE63941 | THBS2 | 7058 | 203083_at | -6.3444 | 0.0000 | |
| GSE77861 | THBS2 | 7058 | 203083_at | 0.4819 | 0.4739 | |
| GSE97050 | THBS2 | 7058 | A_33_P3365735 | 2.6188 | 0.0672 | |
| SRP007169 | THBS2 | 7058 | RNAseq | 4.1193 | 0.0000 | |
| SRP008496 | THBS2 | 7058 | RNAseq | 4.1461 | 0.0000 | |
| SRP064894 | THBS2 | 7058 | RNAseq | 2.4434 | 0.0000 | |
| SRP133303 | THBS2 | 7058 | RNAseq | 2.7110 | 0.0000 | |
| SRP159526 | THBS2 | 7058 | RNAseq | 1.2010 | 0.0036 | |
| SRP193095 | THBS2 | 7058 | RNAseq | 2.6965 | 0.0000 | |
| SRP219564 | THBS2 | 7058 | RNAseq | 2.1970 | 0.0000 | |
| TCGA | THBS2 | 7058 | RNAseq | 0.4750 | 0.0005 |
Upregulated datasets: 14; Downregulated datasets: 1.
Survival by THBS2 expression:
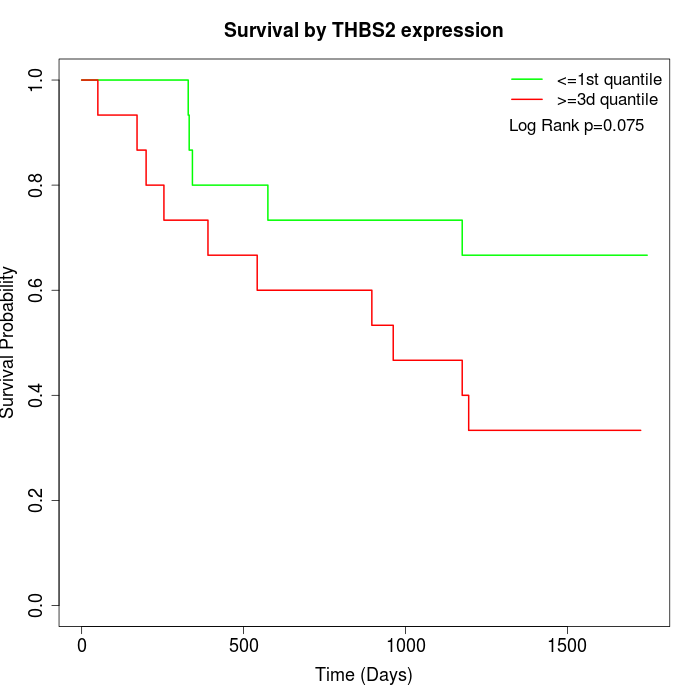 | 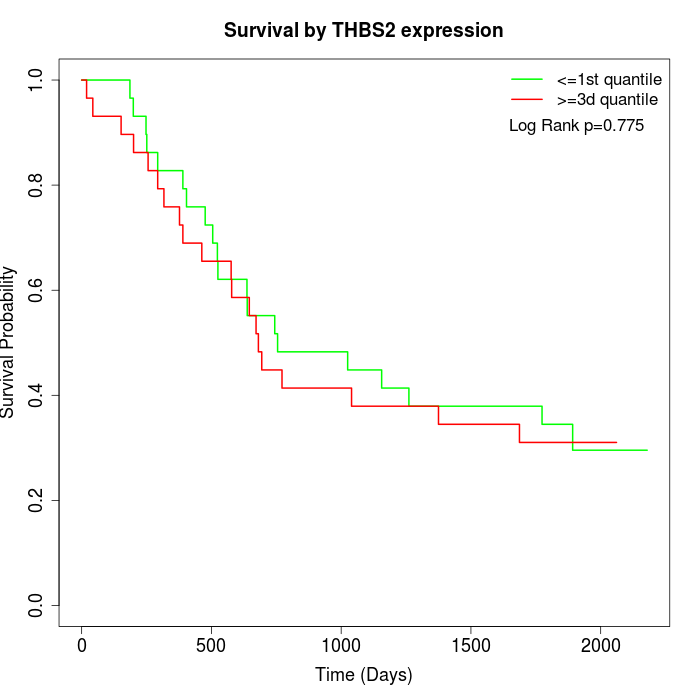 | 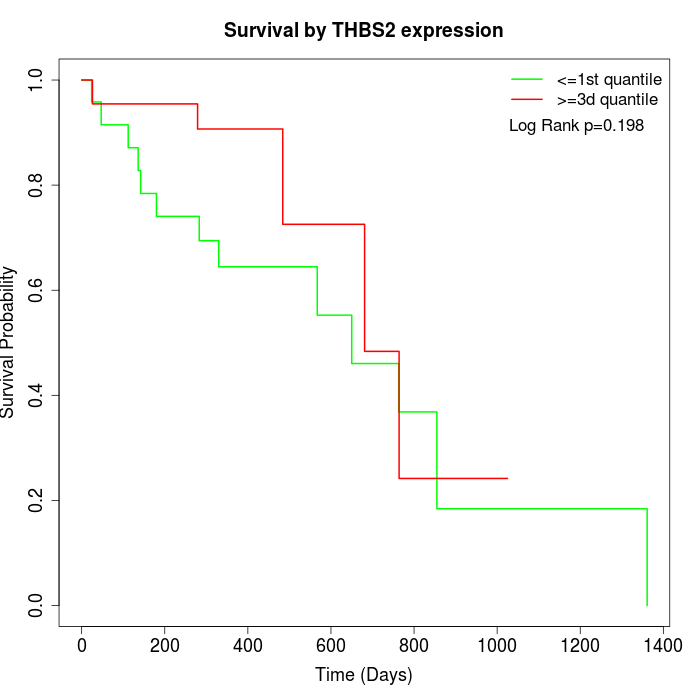 |
| GSE53622 | GSE53624 | TCGA |
Note: Click image to view full size file.
Copy number change of THBS2:
| Dataset | Gene | EntrezID | Gain | Loss | Normal | Detail |
|---|---|---|---|---|---|---|
| GSE15526 | THBS2 | 7058 | 5 | 6 | 19 | |
| GSE20123 | THBS2 | 7058 | 5 | 6 | 19 | |
| GSE43470 | THBS2 | 7058 | 3 | 0 | 40 | |
| GSE46452 | THBS2 | 7058 | 3 | 10 | 46 | |
| GSE47630 | THBS2 | 7058 | 7 | 7 | 26 | |
| GSE54993 | THBS2 | 7058 | 4 | 3 | 63 | |
| GSE54994 | THBS2 | 7058 | 10 | 8 | 35 | |
| GSE60625 | THBS2 | 7058 | 1 | 1 | 9 | |
| GSE74703 | THBS2 | 7058 | 3 | 0 | 33 | |
| GSE74704 | THBS2 | 7058 | 3 | 3 | 14 | |
| TCGA | THBS2 | 7058 | 14 | 20 | 62 |
Total number of gains: 58; Total number of losses: 64; Total Number of normals: 366.
Somatic mutations of THBS2:
Generating mutation plots.
Highly correlated genes for THBS2:
Showing top 20/683 corelated genes with mean PCC>0.5.
| Gene1 | Gene2 | Mean PCC | Num. Datasets | Num. PCC<0 | Num. PCC>0.5 |
|---|---|---|---|---|---|
| THBS2 | COL6A3 | 0.82832 | 13 | 0 | 13 |
| THBS2 | COL3A1 | 0.826562 | 13 | 0 | 13 |
| THBS2 | POSTN | 0.807716 | 13 | 0 | 13 |
| THBS2 | COL1A2 | 0.804081 | 13 | 0 | 12 |
| THBS2 | VCAN | 0.795016 | 13 | 0 | 13 |
| THBS2 | SPARC | 0.792788 | 13 | 0 | 12 |
| THBS2 | COL5A1 | 0.79211 | 13 | 0 | 13 |
| THBS2 | COL5A2 | 0.789301 | 13 | 0 | 13 |
| THBS2 | NID2 | 0.775384 | 9 | 0 | 9 |
| THBS2 | BGN | 0.772455 | 13 | 0 | 13 |
| THBS2 | CTSK | 0.770467 | 13 | 0 | 13 |
| THBS2 | FAP | 0.770459 | 11 | 0 | 11 |
| THBS2 | TCEAL7 | 0.769881 | 3 | 0 | 3 |
| THBS2 | COL11A1 | 0.769175 | 12 | 0 | 11 |
| THBS2 | COL1A1 | 0.755991 | 13 | 0 | 12 |
| THBS2 | THY1 | 0.754264 | 13 | 0 | 13 |
| THBS2 | COL10A1 | 0.748595 | 12 | 0 | 12 |
| THBS2 | SULF1 | 0.745595 | 13 | 0 | 12 |
| THBS2 | PCOLCE | 0.743252 | 13 | 0 | 13 |
| THBS2 | CDH11 | 0.734281 | 12 | 0 | 10 |
For details and further investigation, click here