| Full name: Thy-1 cell surface antigen | Alias Symbol: CD90 | ||
| Type: protein-coding gene | Cytoband: 11q23.3 | ||
| Entrez ID: 7070 | HGNC ID: HGNC:11801 | Ensembl Gene: ENSG00000154096 | OMIM ID: 188230 |
THY1 involved pathways:
| KEGG pathway | Description | View |
|---|---|---|
| hsa04670 | Leukocyte transendothelial migration |
Expression of THY1:
| Dataset | Gene | EntrezID | Probe | Log2FC | Adj.pValue | Expression |
|---|---|---|---|---|---|---|
| GSE17351 | THY1 | 7070 | 208851_s_at | 1.3880 | 0.0947 | |
| GSE20347 | THY1 | 7070 | 208851_s_at | 0.9837 | 0.0000 | |
| GSE23400 | THY1 | 7070 | 208851_s_at | 0.8172 | 0.0000 | |
| GSE26886 | THY1 | 7070 | 208851_s_at | 0.7983 | 0.0085 | |
| GSE29001 | THY1 | 7070 | 208850_s_at | 1.1046 | 0.0001 | |
| GSE38129 | THY1 | 7070 | 208851_s_at | 1.0442 | 0.0000 | |
| GSE45670 | THY1 | 7070 | 213869_x_at | 0.7128 | 0.1141 | |
| GSE53622 | THY1 | 7070 | 40178 | 2.0643 | 0.0000 | |
| GSE53624 | THY1 | 7070 | 40178 | 2.6841 | 0.0000 | |
| GSE63941 | THY1 | 7070 | 208851_s_at | -5.0863 | 0.0000 | |
| GSE77861 | THY1 | 7070 | 208851_s_at | 0.4756 | 0.0369 | |
| GSE97050 | THY1 | 7070 | A_33_P3280845 | 1.8281 | 0.0601 | |
| SRP007169 | THY1 | 7070 | RNAseq | 5.3476 | 0.0000 | |
| SRP008496 | THY1 | 7070 | RNAseq | 5.8953 | 0.0000 | |
| SRP064894 | THY1 | 7070 | RNAseq | 2.9592 | 0.0000 | |
| SRP133303 | THY1 | 7070 | RNAseq | 2.3786 | 0.0000 | |
| SRP159526 | THY1 | 7070 | RNAseq | 1.9885 | 0.0000 | |
| SRP193095 | THY1 | 7070 | RNAseq | 3.0922 | 0.0000 | |
| SRP219564 | THY1 | 7070 | RNAseq | 1.7449 | 0.0895 | |
| TCGA | THY1 | 7070 | RNAseq | 0.4317 | 0.0001 |
Upregulated datasets: 10; Downregulated datasets: 1.
Survival by THY1 expression:
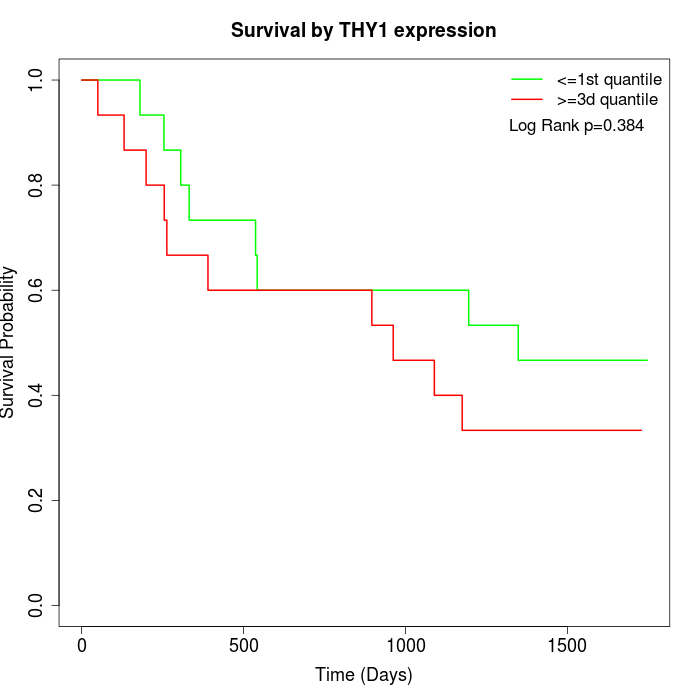 | 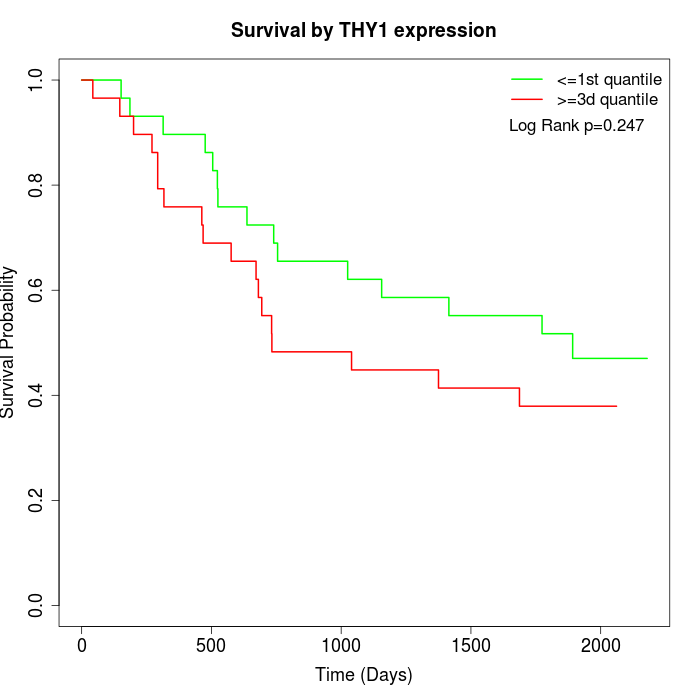 | 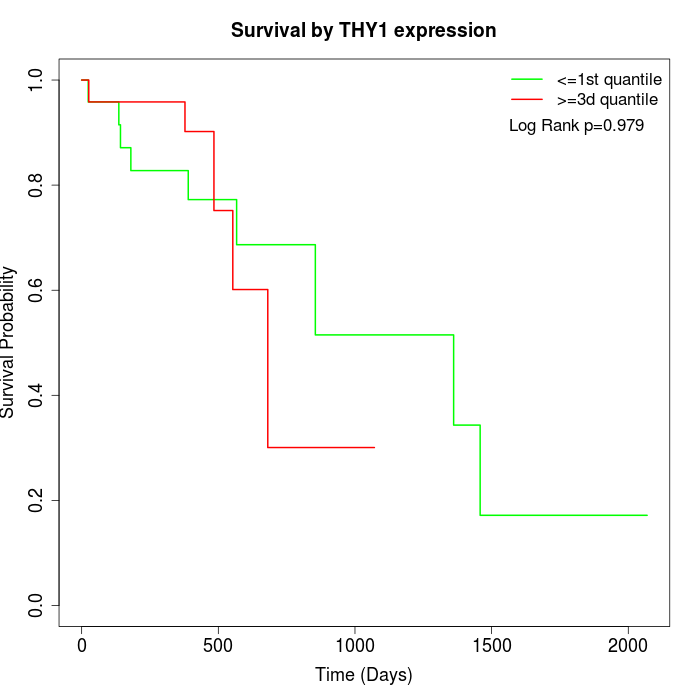 |
| GSE53622 | GSE53624 | TCGA |
Note: Click image to view full size file.
Copy number change of THY1:
| Dataset | Gene | EntrezID | Gain | Loss | Normal | Detail |
|---|---|---|---|---|---|---|
| GSE15526 | THY1 | 7070 | 1 | 11 | 18 | |
| GSE20123 | THY1 | 7070 | 1 | 11 | 18 | |
| GSE43470 | THY1 | 7070 | 2 | 8 | 33 | |
| GSE46452 | THY1 | 7070 | 3 | 26 | 30 | |
| GSE47630 | THY1 | 7070 | 2 | 19 | 19 | |
| GSE54993 | THY1 | 7070 | 10 | 0 | 60 | |
| GSE54994 | THY1 | 7070 | 5 | 19 | 29 | |
| GSE60625 | THY1 | 7070 | 0 | 3 | 8 | |
| GSE74703 | THY1 | 7070 | 1 | 5 | 30 | |
| GSE74704 | THY1 | 7070 | 0 | 7 | 13 | |
| TCGA | THY1 | 7070 | 4 | 51 | 41 |
Total number of gains: 29; Total number of losses: 160; Total Number of normals: 299.
Somatic mutations of THY1:
Generating mutation plots.
Highly correlated genes for THY1:
Showing top 20/1118 corelated genes with mean PCC>0.5.
| Gene1 | Gene2 | Mean PCC | Num. Datasets | Num. PCC<0 | Num. PCC>0.5 |
|---|---|---|---|---|---|
| THY1 | COL6A3 | 0.856881 | 13 | 0 | 13 |
| THY1 | PCOLCE | 0.847779 | 13 | 0 | 13 |
| THY1 | VCAN | 0.8432 | 13 | 0 | 13 |
| THY1 | SPARC | 0.842741 | 13 | 0 | 13 |
| THY1 | COL5A1 | 0.835886 | 13 | 0 | 13 |
| THY1 | COL3A1 | 0.827082 | 13 | 0 | 13 |
| THY1 | POSTN | 0.815105 | 13 | 0 | 13 |
| THY1 | COL5A2 | 0.814489 | 13 | 0 | 13 |
| THY1 | COL1A1 | 0.81406 | 12 | 0 | 12 |
| THY1 | OLFML2B | 0.814054 | 13 | 0 | 13 |
| THY1 | CTSK | 0.811301 | 13 | 0 | 13 |
| THY1 | FAP | 0.808022 | 11 | 0 | 11 |
| THY1 | COL1A2 | 0.80754 | 13 | 0 | 12 |
| THY1 | CDH11 | 0.797719 | 13 | 0 | 13 |
| THY1 | BGN | 0.791817 | 13 | 0 | 13 |
| THY1 | SULF1 | 0.786299 | 13 | 0 | 12 |
| THY1 | ZNF469 | 0.780987 | 9 | 0 | 9 |
| THY1 | PDGFRB | 0.777895 | 13 | 0 | 12 |
| THY1 | TNFAIP6 | 0.767737 | 13 | 0 | 13 |
| THY1 | MICAL1 | 0.765482 | 3 | 0 | 3 |
For details and further investigation, click here