| Full name: transmembrane protein 39A | Alias Symbol: FLJ10902 | ||
| Type: protein-coding gene | Cytoband: 3q13.33 | ||
| Entrez ID: 55254 | HGNC ID: HGNC:25600 | Ensembl Gene: ENSG00000176142 | OMIM ID: |
Expression of TMEM39A:
| Dataset | Gene | EntrezID | Probe | Log2FC | Adj.pValue | Expression |
|---|---|---|---|---|---|---|
| GSE17351 | TMEM39A | 55254 | 222690_s_at | 0.7579 | 0.0374 | |
| GSE20347 | TMEM39A | 55254 | 218615_s_at | 0.7296 | 0.0001 | |
| GSE23400 | TMEM39A | 55254 | 218615_s_at | 0.3436 | 0.0000 | |
| GSE26886 | TMEM39A | 55254 | 222690_s_at | 0.0185 | 0.9342 | |
| GSE29001 | TMEM39A | 55254 | 218615_s_at | 0.8491 | 0.0004 | |
| GSE38129 | TMEM39A | 55254 | 218615_s_at | 0.7591 | 0.0000 | |
| GSE45670 | TMEM39A | 55254 | 222690_s_at | 0.8016 | 0.0003 | |
| GSE53622 | TMEM39A | 55254 | 3108 | 0.4064 | 0.0000 | |
| GSE53624 | TMEM39A | 55254 | 3108 | 0.6952 | 0.0000 | |
| GSE63941 | TMEM39A | 55254 | 222690_s_at | -0.1336 | 0.7835 | |
| GSE77861 | TMEM39A | 55254 | 222690_s_at | 0.4321 | 0.0806 | |
| GSE97050 | TMEM39A | 55254 | A_23_P84334 | 0.1479 | 0.4412 | |
| SRP007169 | TMEM39A | 55254 | RNAseq | 1.2907 | 0.0003 | |
| SRP008496 | TMEM39A | 55254 | RNAseq | 1.4646 | 0.0000 | |
| SRP064894 | TMEM39A | 55254 | RNAseq | 0.8414 | 0.0000 | |
| SRP133303 | TMEM39A | 55254 | RNAseq | 0.8558 | 0.0000 | |
| SRP159526 | TMEM39A | 55254 | RNAseq | 0.9368 | 0.0000 | |
| SRP193095 | TMEM39A | 55254 | RNAseq | 0.5776 | 0.0000 | |
| SRP219564 | TMEM39A | 55254 | RNAseq | 0.8841 | 0.0002 | |
| TCGA | TMEM39A | 55254 | RNAseq | 0.0936 | 0.1109 |
Upregulated datasets: 2; Downregulated datasets: 0.
Survival by TMEM39A expression:
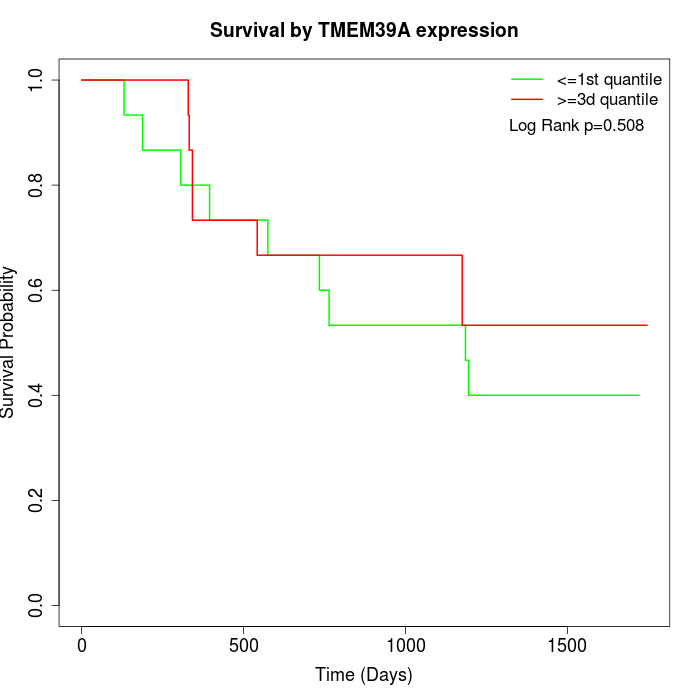 | 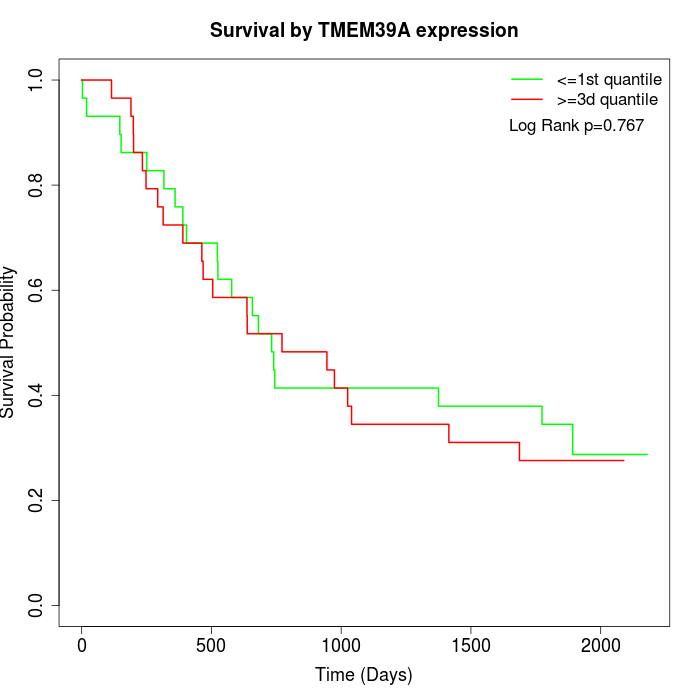 | 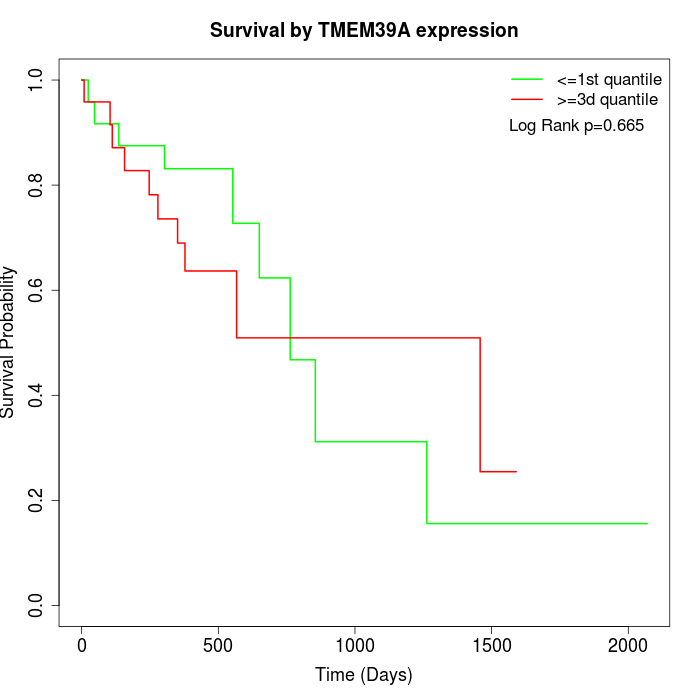 |
| GSE53622 | GSE53624 | TCGA |
Note: Click image to view full size file.
Copy number change of TMEM39A:
| Dataset | Gene | EntrezID | Gain | Loss | Normal | Detail |
|---|---|---|---|---|---|---|
| GSE15526 | TMEM39A | 55254 | 17 | 0 | 13 | |
| GSE20123 | TMEM39A | 55254 | 17 | 0 | 13 | |
| GSE43470 | TMEM39A | 55254 | 21 | 1 | 21 | |
| GSE46452 | TMEM39A | 55254 | 14 | 5 | 40 | |
| GSE47630 | TMEM39A | 55254 | 16 | 5 | 19 | |
| GSE54993 | TMEM39A | 55254 | 2 | 6 | 62 | |
| GSE54994 | TMEM39A | 55254 | 30 | 4 | 19 | |
| GSE60625 | TMEM39A | 55254 | 0 | 6 | 5 | |
| GSE74703 | TMEM39A | 55254 | 17 | 1 | 18 | |
| GSE74704 | TMEM39A | 55254 | 13 | 0 | 7 | |
| TCGA | TMEM39A | 55254 | 52 | 7 | 37 |
Total number of gains: 199; Total number of losses: 35; Total Number of normals: 254.
Somatic mutations of TMEM39A:
Generating mutation plots.
Highly correlated genes for TMEM39A:
Showing top 20/522 corelated genes with mean PCC>0.5.
| Gene1 | Gene2 | Mean PCC | Num. Datasets | Num. PCC<0 | Num. PCC>0.5 |
|---|---|---|---|---|---|
| TMEM39A | TIMMDC1 | 0.716477 | 4 | 0 | 4 |
| TMEM39A | UMPS | 0.708692 | 9 | 0 | 9 |
| TMEM39A | PIK3R4 | 0.681103 | 11 | 0 | 9 |
| TMEM39A | NEK2 | 0.669156 | 7 | 0 | 7 |
| TMEM39A | SCG5 | 0.666789 | 6 | 0 | 6 |
| TMEM39A | MCM2 | 0.662295 | 11 | 0 | 9 |
| TMEM39A | PLEKHG4 | 0.655275 | 3 | 0 | 3 |
| TMEM39A | APMAP | 0.653337 | 9 | 0 | 8 |
| TMEM39A | CKS1B | 0.650979 | 10 | 0 | 8 |
| TMEM39A | RUVBL1 | 0.650425 | 11 | 0 | 8 |
| TMEM39A | HMCES | 0.650128 | 9 | 0 | 8 |
| TMEM39A | TPX2 | 0.648224 | 8 | 0 | 8 |
| TMEM39A | RFC4 | 0.647974 | 10 | 0 | 8 |
| TMEM39A | SOX30 | 0.645233 | 3 | 0 | 3 |
| TMEM39A | CXorf56 | 0.64326 | 7 | 0 | 5 |
| TMEM39A | LINC01128 | 0.642975 | 3 | 0 | 3 |
| TMEM39A | DTD2 | 0.640025 | 3 | 0 | 3 |
| TMEM39A | ECT2 | 0.639407 | 10 | 0 | 9 |
| TMEM39A | BCL2L12 | 0.639103 | 5 | 0 | 4 |
| TMEM39A | TOR3A | 0.638993 | 9 | 0 | 8 |
For details and further investigation, click here