| Full name: adipocyte plasma membrane associated protein | Alias Symbol: BSCv | ||
| Type: protein-coding gene | Cytoband: 20p11.21 | ||
| Entrez ID: 57136 | HGNC ID: HGNC:13238 | Ensembl Gene: ENSG00000101474 | OMIM ID: 615884 |
Expression of APMAP:
| Dataset | Gene | EntrezID | Probe | Log2FC | Adj.pValue | Expression |
|---|---|---|---|---|---|---|
| GSE17351 | APMAP | 57136 | 206656_s_at | 1.6319 | 0.0137 | |
| GSE20347 | APMAP | 57136 | 206656_s_at | 1.1407 | 0.0000 | |
| GSE23400 | APMAP | 57136 | 206656_s_at | 1.2449 | 0.0000 | |
| GSE26886 | APMAP | 57136 | 206656_s_at | 0.8381 | 0.0001 | |
| GSE29001 | APMAP | 57136 | 206656_s_at | 1.1146 | 0.0001 | |
| GSE38129 | APMAP | 57136 | 206656_s_at | 1.2606 | 0.0000 | |
| GSE45670 | APMAP | 57136 | 206656_s_at | 0.8540 | 0.0001 | |
| GSE53622 | APMAP | 57136 | 87254 | 1.4874 | 0.0000 | |
| GSE53624 | APMAP | 57136 | 87254 | 1.4144 | 0.0000 | |
| GSE63941 | APMAP | 57136 | 206656_s_at | -0.7740 | 0.0704 | |
| GSE77861 | APMAP | 57136 | 206656_s_at | 1.3080 | 0.0011 | |
| SRP007169 | APMAP | 57136 | RNAseq | 2.0740 | 0.0000 | |
| SRP008496 | APMAP | 57136 | RNAseq | 2.4152 | 0.0000 | |
| SRP064894 | APMAP | 57136 | RNAseq | 1.3459 | 0.0000 | |
| SRP133303 | APMAP | 57136 | RNAseq | 1.2258 | 0.0000 | |
| SRP159526 | APMAP | 57136 | RNAseq | 1.7145 | 0.0000 | |
| SRP193095 | APMAP | 57136 | RNAseq | 1.0659 | 0.0000 | |
| SRP219564 | APMAP | 57136 | RNAseq | 1.5360 | 0.0000 |
Upregulated datasets: 15; Downregulated datasets: 0.
Survival by APMAP expression:
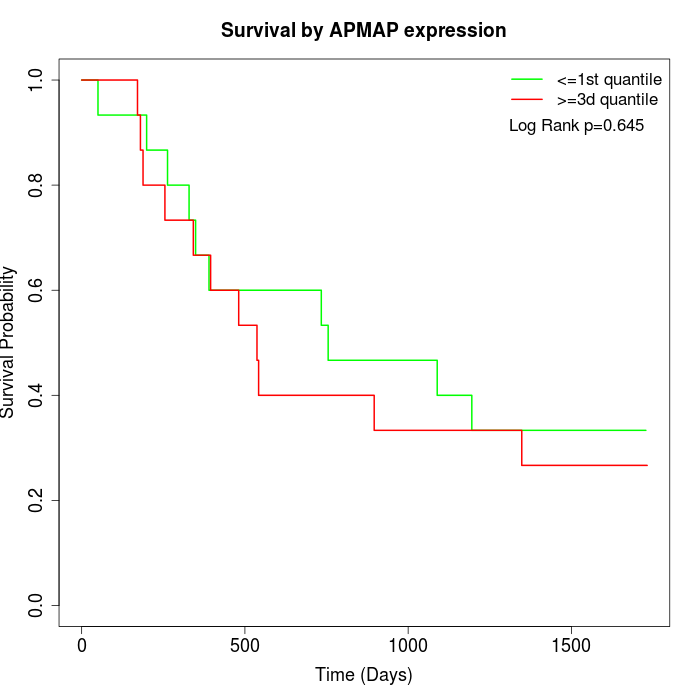 | 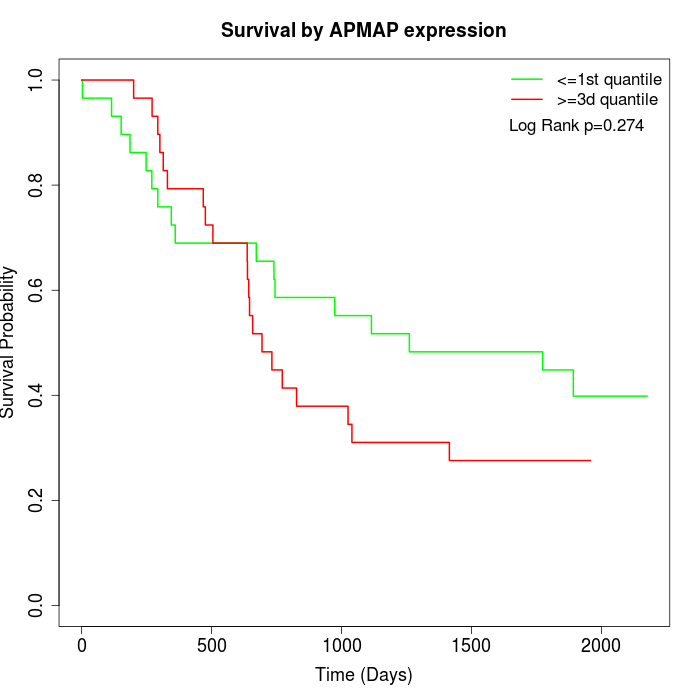 |
| GSE53622 | GSE53624 |
Note: Click image to view full size file.
Copy number change of APMAP:
| Dataset | Gene | EntrezID | Gain | Loss | Normal | Detail |
|---|---|---|---|---|---|---|
| GSE15526 | APMAP | 57136 | 12 | 2 | 16 | |
| GSE20123 | APMAP | 57136 | 12 | 2 | 16 | |
| GSE43470 | APMAP | 57136 | 11 | 1 | 31 | |
| GSE46452 | APMAP | 57136 | 27 | 1 | 31 | |
| GSE47630 | APMAP | 57136 | 17 | 4 | 19 | |
| GSE54993 | APMAP | 57136 | 0 | 17 | 53 | |
| GSE54994 | APMAP | 57136 | 27 | 1 | 25 | |
| GSE60625 | APMAP | 57136 | 0 | 0 | 11 | |
| GSE74703 | APMAP | 57136 | 10 | 1 | 25 | |
| GSE74704 | APMAP | 57136 | 7 | 1 | 12 | |
| TCGA | APMAP | 57136 | 44 | 9 | 43 |
Total number of gains: 167; Total number of losses: 39; Total Number of normals: 282.
Somatic mutations of APMAP:
Generating mutation plots.
Highly correlated genes for APMAP:
Showing top 20/1502 corelated genes with mean PCC>0.5.
| Gene1 | Gene2 | Mean PCC | Num. Datasets | Num. PCC<0 | Num. PCC>0.5 |
|---|---|---|---|---|---|
| APMAP | CDC25B | 0.77703 | 10 | 0 | 10 |
| APMAP | LAPTM4B | 0.77629 | 10 | 0 | 10 |
| APMAP | XRN2 | 0.772881 | 6 | 0 | 5 |
| APMAP | PTDSS1 | 0.770622 | 10 | 0 | 10 |
| APMAP | DIABLO | 0.765524 | 8 | 0 | 8 |
| APMAP | GINS1 | 0.76338 | 10 | 0 | 9 |
| APMAP | MMP11 | 0.753151 | 8 | 0 | 8 |
| APMAP | CTHRC1 | 0.750417 | 7 | 0 | 7 |
| APMAP | CLPTM1L | 0.748948 | 6 | 0 | 6 |
| APMAP | NXT1 | 0.748902 | 10 | 0 | 10 |
| APMAP | RPN2 | 0.748315 | 10 | 0 | 9 |
| APMAP | MEST | 0.743562 | 10 | 0 | 10 |
| APMAP | MFAP2 | 0.743294 | 10 | 0 | 10 |
| APMAP | ENTPD6 | 0.743082 | 7 | 0 | 6 |
| APMAP | BID | 0.741465 | 10 | 0 | 10 |
| APMAP | RPN1 | 0.739698 | 9 | 0 | 9 |
| APMAP | DNMT1 | 0.739073 | 10 | 0 | 10 |
| APMAP | ATRN | 0.737415 | 10 | 0 | 9 |
| APMAP | PARP1 | 0.734125 | 10 | 0 | 10 |
| APMAP | TOR3A | 0.733958 | 9 | 0 | 9 |
For details and further investigation, click here