| Full name: TMEM9 domain family member B | Alias Symbol: | ||
| Type: protein-coding gene | Cytoband: 11p15.4 | ||
| Entrez ID: 56674 | HGNC ID: HGNC:1168 | Ensembl Gene: ENSG00000175348 | OMIM ID: |
Expression of TMEM9B:
| Dataset | Gene | EntrezID | Probe | Log2FC | Adj.pValue | Expression |
|---|---|---|---|---|---|---|
| GSE17351 | TMEM9B | 56674 | 218065_s_at | -0.7188 | 0.2563 | |
| GSE20347 | TMEM9B | 56674 | 218065_s_at | -1.3388 | 0.0000 | |
| GSE23400 | TMEM9B | 56674 | 218065_s_at | -0.4997 | 0.0000 | |
| GSE26886 | TMEM9B | 56674 | 218065_s_at | -1.1385 | 0.0000 | |
| GSE29001 | TMEM9B | 56674 | 218065_s_at | -0.7425 | 0.0007 | |
| GSE38129 | TMEM9B | 56674 | 218065_s_at | -0.8402 | 0.0000 | |
| GSE45670 | TMEM9B | 56674 | 218065_s_at | -0.4250 | 0.0211 | |
| GSE53622 | TMEM9B | 56674 | 47694 | -0.9946 | 0.0000 | |
| GSE53624 | TMEM9B | 56674 | 47694 | -1.0174 | 0.0000 | |
| GSE63941 | TMEM9B | 56674 | 218065_s_at | -1.0563 | 0.0038 | |
| GSE77861 | TMEM9B | 56674 | 218065_s_at | -0.8308 | 0.0017 | |
| GSE97050 | TMEM9B | 56674 | A_23_P162087 | -0.1474 | 0.7421 | |
| SRP007169 | TMEM9B | 56674 | RNAseq | -0.9491 | 0.0044 | |
| SRP008496 | TMEM9B | 56674 | RNAseq | -0.5616 | 0.0098 | |
| SRP064894 | TMEM9B | 56674 | RNAseq | -0.7529 | 0.0000 | |
| SRP133303 | TMEM9B | 56674 | RNAseq | -0.6852 | 0.0000 | |
| SRP159526 | TMEM9B | 56674 | RNAseq | -0.9519 | 0.0191 | |
| SRP193095 | TMEM9B | 56674 | RNAseq | -1.1839 | 0.0000 | |
| SRP219564 | TMEM9B | 56674 | RNAseq | -0.6644 | 0.1626 | |
| TCGA | TMEM9B | 56674 | RNAseq | -0.1109 | 0.0380 |
Upregulated datasets: 0; Downregulated datasets: 5.
Survival by TMEM9B expression:
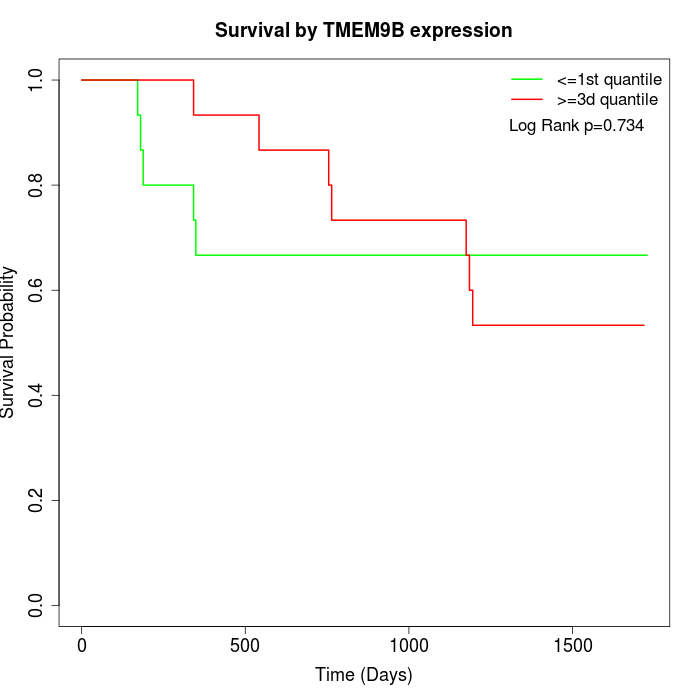 | 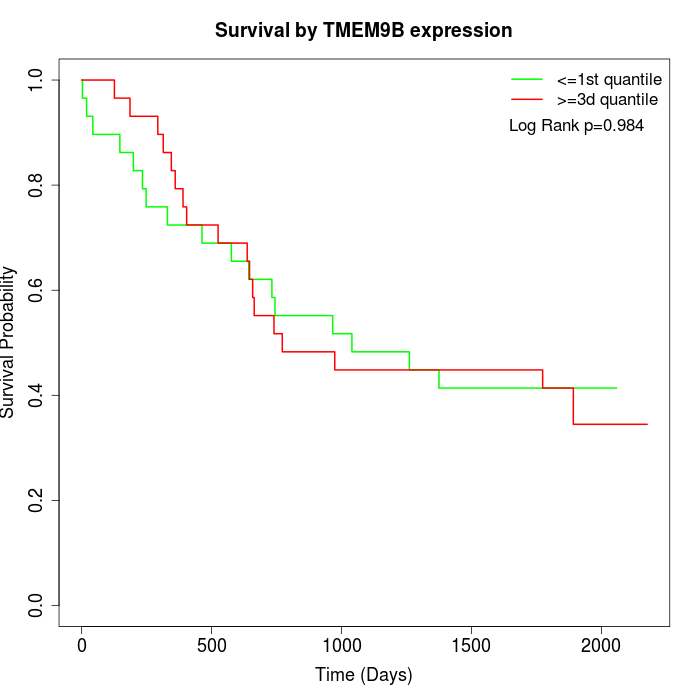 | 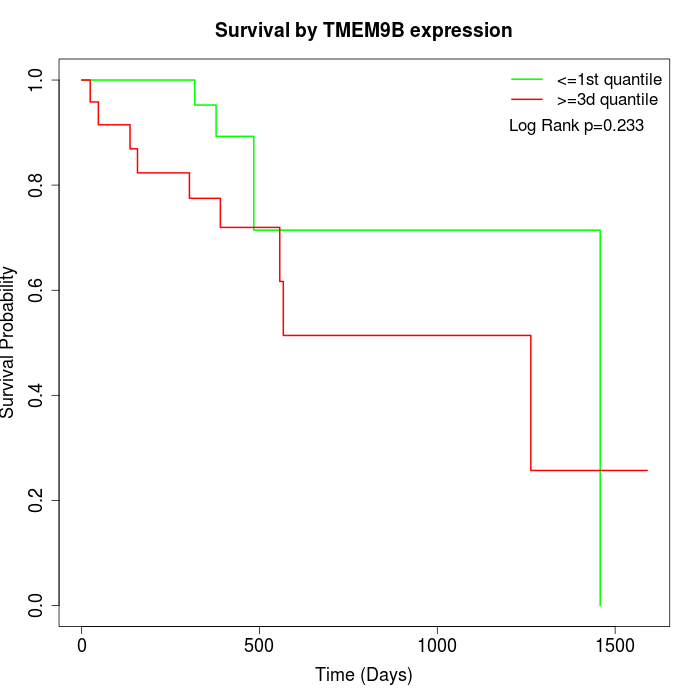 |
| GSE53622 | GSE53624 | TCGA |
Note: Click image to view full size file.
Copy number change of TMEM9B:
| Dataset | Gene | EntrezID | Gain | Loss | Normal | Detail |
|---|---|---|---|---|---|---|
| GSE15526 | TMEM9B | 56674 | 0 | 10 | 20 | |
| GSE20123 | TMEM9B | 56674 | 0 | 10 | 20 | |
| GSE43470 | TMEM9B | 56674 | 1 | 5 | 37 | |
| GSE46452 | TMEM9B | 56674 | 7 | 5 | 47 | |
| GSE47630 | TMEM9B | 56674 | 2 | 12 | 26 | |
| GSE54993 | TMEM9B | 56674 | 3 | 1 | 66 | |
| GSE54994 | TMEM9B | 56674 | 2 | 12 | 39 | |
| GSE60625 | TMEM9B | 56674 | 0 | 0 | 11 | |
| GSE74703 | TMEM9B | 56674 | 1 | 3 | 32 | |
| GSE74704 | TMEM9B | 56674 | 0 | 8 | 12 | |
| TCGA | TMEM9B | 56674 | 11 | 34 | 51 |
Total number of gains: 27; Total number of losses: 100; Total Number of normals: 361.
Somatic mutations of TMEM9B:
Generating mutation plots.
Highly correlated genes for TMEM9B:
Showing top 20/1622 corelated genes with mean PCC>0.5.
| Gene1 | Gene2 | Mean PCC | Num. Datasets | Num. PCC<0 | Num. PCC>0.5 |
|---|---|---|---|---|---|
| TMEM9B | RNF141 | 0.815048 | 13 | 0 | 13 |
| TMEM9B | RASSF5 | 0.813014 | 7 | 0 | 7 |
| TMEM9B | CHP1 | 0.804949 | 10 | 0 | 10 |
| TMEM9B | NIPAL1 | 0.803045 | 3 | 0 | 3 |
| TMEM9B | EPGN | 0.800251 | 3 | 0 | 3 |
| TMEM9B | TOLLIP | 0.798107 | 10 | 0 | 10 |
| TMEM9B | RAB11A | 0.79502 | 11 | 0 | 11 |
| TMEM9B | FAM3D | 0.794322 | 7 | 0 | 7 |
| TMEM9B | CASC3 | 0.792011 | 3 | 0 | 3 |
| TMEM9B | UBL3 | 0.790416 | 11 | 0 | 11 |
| TMEM9B | BLNK | 0.788566 | 11 | 0 | 11 |
| TMEM9B | CYSRT1 | 0.786373 | 6 | 0 | 6 |
| TMEM9B | TP53I3 | 0.785908 | 12 | 0 | 11 |
| TMEM9B | SERPINB1 | 0.784779 | 11 | 0 | 11 |
| TMEM9B | SLC16A6 | 0.784509 | 11 | 0 | 11 |
| TMEM9B | EPS8L2 | 0.78433 | 11 | 0 | 10 |
| TMEM9B | EMP1 | 0.783267 | 10 | 0 | 10 |
| TMEM9B | SCEL | 0.782961 | 10 | 0 | 10 |
| TMEM9B | KRT78 | 0.782193 | 7 | 0 | 7 |
| TMEM9B | MAL | 0.779309 | 10 | 0 | 10 |
For details and further investigation, click here