| Full name: TP53 regulated inhibitor of apoptosis 1 | Alias Symbol: P53CSV|WF-1|HSPC132|p53CSV|MDM35 | ||
| Type: protein-coding gene | Cytoband: 12q24.31 | ||
| Entrez ID: 51499 | HGNC ID: HGNC:26937 | Ensembl Gene: ENSG00000170855 | OMIM ID: 614943 |
Screen Evidence:
| |||
Expression of TRIAP1:
| Dataset | Gene | EntrezID | Probe | Log2FC | Adj.pValue | Expression |
|---|---|---|---|---|---|---|
| GSE17351 | TRIAP1 | 51499 | 218403_at | 0.2727 | 0.5069 | |
| GSE20347 | TRIAP1 | 51499 | 218403_at | 0.1622 | 0.3328 | |
| GSE23400 | TRIAP1 | 51499 | 218403_at | 0.2678 | 0.0000 | |
| GSE26886 | TRIAP1 | 51499 | 218403_at | -0.2128 | 0.2311 | |
| GSE29001 | TRIAP1 | 51499 | 218403_at | 0.3713 | 0.1939 | |
| GSE38129 | TRIAP1 | 51499 | 218403_at | 0.2759 | 0.0119 | |
| GSE45670 | TRIAP1 | 51499 | 218403_at | 0.3018 | 0.0059 | |
| GSE53622 | TRIAP1 | 51499 | 115458 | 0.1661 | 0.0310 | |
| GSE53624 | TRIAP1 | 51499 | 115458 | 0.2507 | 0.0011 | |
| GSE63941 | TRIAP1 | 51499 | 218403_at | -0.0893 | 0.8119 | |
| GSE77861 | TRIAP1 | 51499 | 218403_at | 0.0758 | 0.7146 | |
| GSE97050 | TRIAP1 | 51499 | A_23_P128408 | 0.2185 | 0.2731 | |
| SRP007169 | TRIAP1 | 51499 | RNAseq | -0.2355 | 0.5148 | |
| SRP008496 | TRIAP1 | 51499 | RNAseq | -0.0458 | 0.8119 | |
| SRP064894 | TRIAP1 | 51499 | RNAseq | 0.1587 | 0.2829 | |
| SRP133303 | TRIAP1 | 51499 | RNAseq | 0.1117 | 0.4340 | |
| SRP159526 | TRIAP1 | 51499 | RNAseq | 0.2550 | 0.2610 | |
| SRP193095 | TRIAP1 | 51499 | RNAseq | -0.3998 | 0.0064 | |
| SRP219564 | TRIAP1 | 51499 | RNAseq | 0.0439 | 0.8889 | |
| TCGA | TRIAP1 | 51499 | RNAseq | 0.1542 | 0.0119 |
Upregulated datasets: 0; Downregulated datasets: 0.
Survival by TRIAP1 expression:
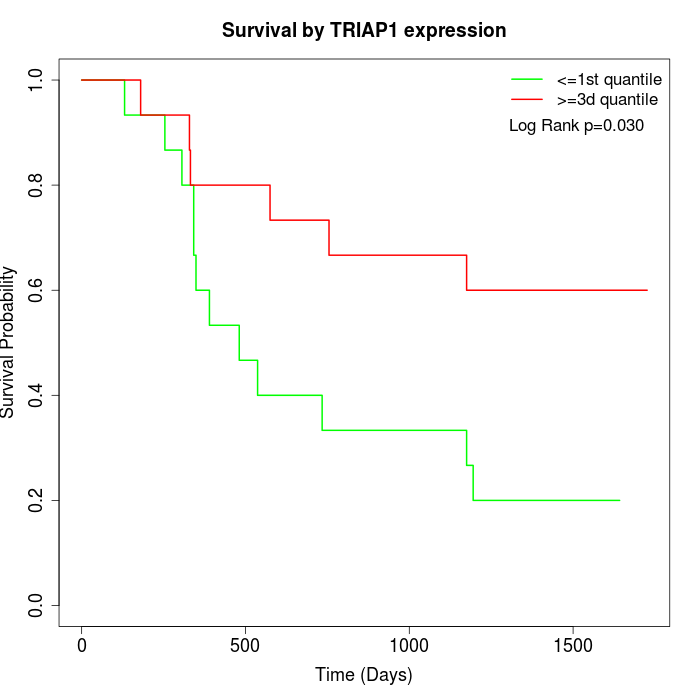 | 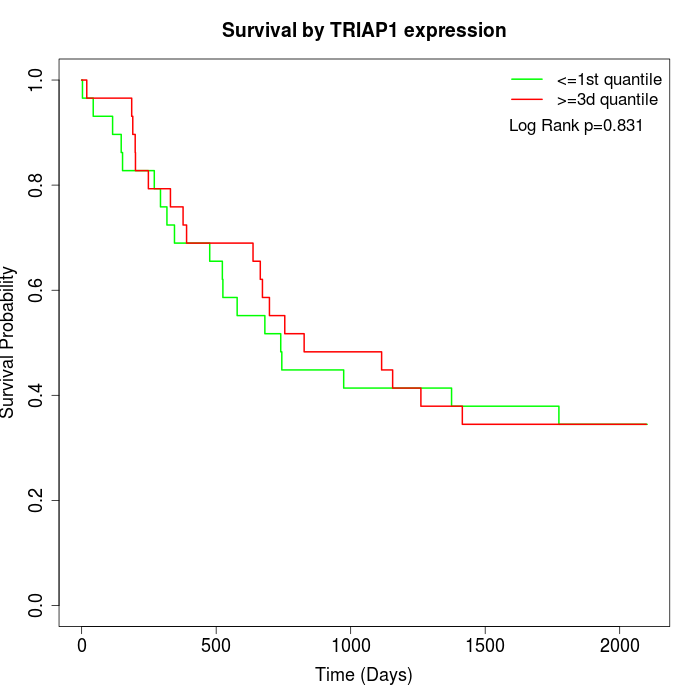 | 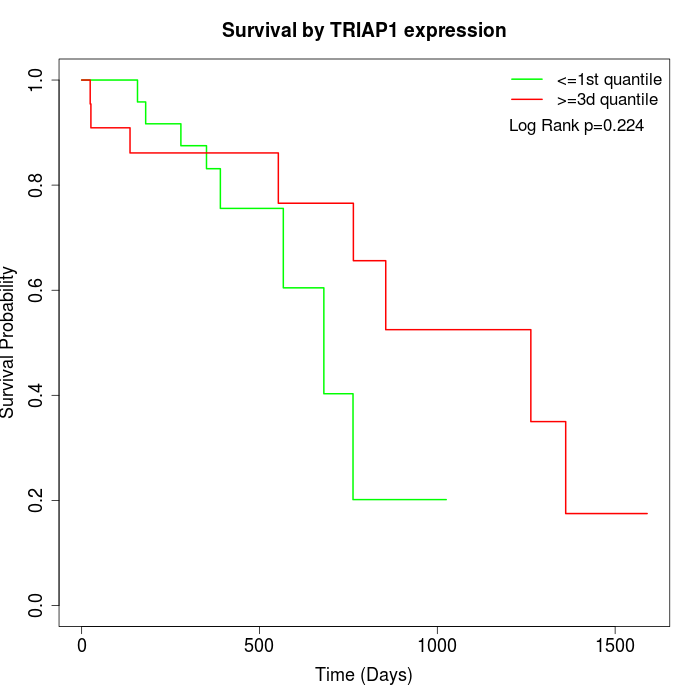 |
| GSE53622 | GSE53624 | TCGA |
Note: Click image to view full size file.
Copy number change of TRIAP1:
| Dataset | Gene | EntrezID | Gain | Loss | Normal | Detail |
|---|---|---|---|---|---|---|
| GSE15526 | TRIAP1 | 51499 | 6 | 2 | 22 | |
| GSE20123 | TRIAP1 | 51499 | 6 | 2 | 22 | |
| GSE43470 | TRIAP1 | 51499 | 2 | 2 | 39 | |
| GSE46452 | TRIAP1 | 51499 | 9 | 1 | 49 | |
| GSE47630 | TRIAP1 | 51499 | 9 | 3 | 28 | |
| GSE54993 | TRIAP1 | 51499 | 0 | 5 | 65 | |
| GSE54994 | TRIAP1 | 51499 | 7 | 6 | 40 | |
| GSE60625 | TRIAP1 | 51499 | 0 | 0 | 11 | |
| GSE74703 | TRIAP1 | 51499 | 2 | 1 | 33 | |
| GSE74704 | TRIAP1 | 51499 | 3 | 2 | 15 | |
| TCGA | TRIAP1 | 51499 | 21 | 10 | 65 |
Total number of gains: 65; Total number of losses: 34; Total Number of normals: 389.
Somatic mutations of TRIAP1:
Generating mutation plots.
Highly correlated genes for TRIAP1:
Showing top 20/586 corelated genes with mean PCC>0.5.
| Gene1 | Gene2 | Mean PCC | Num. Datasets | Num. PCC<0 | Num. PCC>0.5 |
|---|---|---|---|---|---|
| TRIAP1 | DYRK2 | 0.791083 | 3 | 0 | 3 |
| TRIAP1 | SRSF1 | 0.783693 | 3 | 0 | 3 |
| TRIAP1 | CDC37 | 0.775153 | 3 | 0 | 3 |
| TRIAP1 | RRP36 | 0.754575 | 4 | 0 | 4 |
| TRIAP1 | TRIT1 | 0.753403 | 4 | 0 | 4 |
| TRIAP1 | PSMC6 | 0.750064 | 3 | 0 | 3 |
| TRIAP1 | TADA2A | 0.748026 | 3 | 0 | 3 |
| TRIAP1 | DTX4 | 0.740989 | 3 | 0 | 3 |
| TRIAP1 | FRS2 | 0.740075 | 3 | 0 | 3 |
| TRIAP1 | ANKRD50 | 0.738667 | 3 | 0 | 3 |
| TRIAP1 | SHISA5 | 0.735236 | 3 | 0 | 3 |
| TRIAP1 | MORN2 | 0.735029 | 3 | 0 | 3 |
| TRIAP1 | PUSL1 | 0.734845 | 3 | 0 | 3 |
| TRIAP1 | ELOF1 | 0.73092 | 4 | 0 | 4 |
| TRIAP1 | MRPL1 | 0.730002 | 4 | 0 | 3 |
| TRIAP1 | ISY1 | 0.728512 | 3 | 0 | 3 |
| TRIAP1 | RAB7A | 0.723704 | 3 | 0 | 3 |
| TRIAP1 | ATG4C | 0.723474 | 3 | 0 | 3 |
| TRIAP1 | FKBPL | 0.720057 | 4 | 0 | 4 |
| TRIAP1 | LARS2 | 0.716647 | 4 | 0 | 4 |
For details and further investigation, click here