| Full name: tetraspanin 18 | Alias Symbol: TSPAN | ||
| Type: protein-coding gene | Cytoband: 11p11.2 | ||
| Entrez ID: 90139 | HGNC ID: HGNC:20660 | Ensembl Gene: ENSG00000157570 | OMIM ID: |
Expression of TSPAN18:
| Dataset | Gene | EntrezID | Probe | Log2FC | Adj.pValue | Expression |
|---|---|---|---|---|---|---|
| GSE17351 | TSPAN18 | 90139 | 227307_at | -0.6146 | 0.5751 | |
| GSE26886 | TSPAN18 | 90139 | 228819_at | 1.2177 | 0.0028 | |
| GSE45670 | TSPAN18 | 90139 | 227307_at | -0.8480 | 0.0770 | |
| GSE53622 | TSPAN18 | 90139 | 29582 | -0.0538 | 0.7333 | |
| GSE53624 | TSPAN18 | 90139 | 29582 | 0.2053 | 0.0781 | |
| GSE63941 | TSPAN18 | 90139 | 227307_at | 1.0735 | 0.2477 | |
| GSE77861 | TSPAN18 | 90139 | 227307_at | 0.6199 | 0.1877 | |
| GSE97050 | TSPAN18 | 90139 | A_24_P13083 | -0.6736 | 0.2237 | |
| SRP007169 | TSPAN18 | 90139 | RNAseq | 4.6151 | 0.0000 | |
| SRP008496 | TSPAN18 | 90139 | RNAseq | 5.2970 | 0.0000 | |
| SRP064894 | TSPAN18 | 90139 | RNAseq | 0.0038 | 0.9916 | |
| SRP133303 | TSPAN18 | 90139 | RNAseq | -0.0550 | 0.8972 | |
| SRP159526 | TSPAN18 | 90139 | RNAseq | 0.5228 | 0.2585 | |
| SRP193095 | TSPAN18 | 90139 | RNAseq | 1.8409 | 0.0000 | |
| SRP219564 | TSPAN18 | 90139 | RNAseq | -0.3288 | 0.7471 | |
| TCGA | TSPAN18 | 90139 | RNAseq | -0.2511 | 0.1482 |
Upregulated datasets: 4; Downregulated datasets: 0.
Survival by TSPAN18 expression:
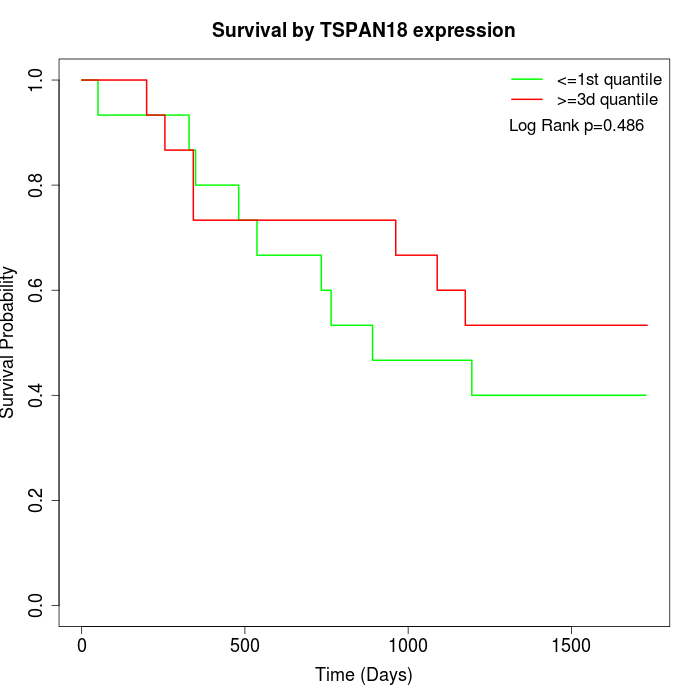 | 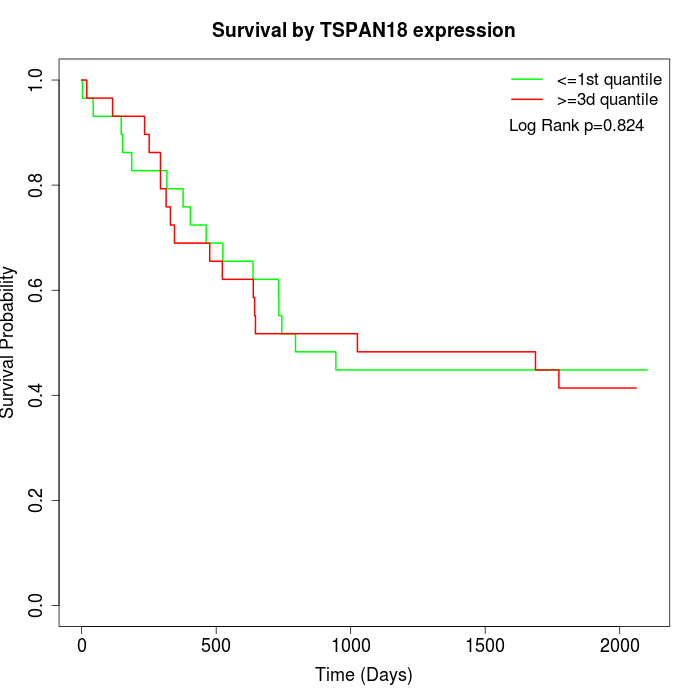 |  |
| GSE53622 | GSE53624 | TCGA |
Note: Click image to view full size file.
Copy number change of TSPAN18:
| Dataset | Gene | EntrezID | Gain | Loss | Normal | Detail |
|---|---|---|---|---|---|---|
| GSE15526 | TSPAN18 | 90139 | 1 | 8 | 21 | |
| GSE20123 | TSPAN18 | 90139 | 1 | 7 | 22 | |
| GSE43470 | TSPAN18 | 90139 | 2 | 4 | 37 | |
| GSE46452 | TSPAN18 | 90139 | 8 | 5 | 46 | |
| GSE47630 | TSPAN18 | 90139 | 3 | 9 | 28 | |
| GSE54993 | TSPAN18 | 90139 | 3 | 0 | 67 | |
| GSE54994 | TSPAN18 | 90139 | 4 | 9 | 40 | |
| GSE60625 | TSPAN18 | 90139 | 0 | 0 | 11 | |
| GSE74703 | TSPAN18 | 90139 | 2 | 2 | 32 | |
| GSE74704 | TSPAN18 | 90139 | 1 | 6 | 13 | |
| TCGA | TSPAN18 | 90139 | 14 | 21 | 61 |
Total number of gains: 39; Total number of losses: 71; Total Number of normals: 378.
Somatic mutations of TSPAN18:
Generating mutation plots.
Highly correlated genes for TSPAN18:
Showing top 20/639 corelated genes with mean PCC>0.5.
| Gene1 | Gene2 | Mean PCC | Num. Datasets | Num. PCC<0 | Num. PCC>0.5 |
|---|---|---|---|---|---|
| TSPAN18 | EPB41L2 | 0.766015 | 5 | 0 | 5 |
| TSPAN18 | SOX5 | 0.758217 | 4 | 0 | 4 |
| TSPAN18 | WSCD2 | 0.75441 | 3 | 0 | 3 |
| TSPAN18 | CORO6 | 0.739005 | 3 | 0 | 3 |
| TSPAN18 | ECSCR | 0.735767 | 4 | 0 | 4 |
| TSPAN18 | GSX1 | 0.727608 | 3 | 0 | 3 |
| TSPAN18 | C3orf70 | 0.721203 | 5 | 0 | 4 |
| TSPAN18 | DCHS1 | 0.719276 | 5 | 0 | 4 |
| TSPAN18 | EBF3 | 0.718819 | 3 | 0 | 3 |
| TSPAN18 | LGI2 | 0.717385 | 3 | 0 | 3 |
| TSPAN18 | PDGFD | 0.716916 | 3 | 0 | 3 |
| TSPAN18 | PDE1C | 0.715023 | 3 | 0 | 3 |
| TSPAN18 | AKT3 | 0.713738 | 7 | 0 | 5 |
| TSPAN18 | SMOC2 | 0.710848 | 7 | 0 | 6 |
| TSPAN18 | RILPL1 | 0.710109 | 3 | 0 | 3 |
| TSPAN18 | ATP2B4 | 0.70947 | 4 | 0 | 4 |
| TSPAN18 | MYCT1 | 0.704296 | 3 | 0 | 3 |
| TSPAN18 | IDS | 0.700667 | 3 | 0 | 3 |
| TSPAN18 | CC2D2A | 0.699456 | 5 | 0 | 5 |
| TSPAN18 | CTSF | 0.698729 | 4 | 0 | 3 |
For details and further investigation, click here