| Full name: tetraspanin 2 | Alias Symbol: TSPAN-2|TSN2|FLJ12082 | ||
| Type: protein-coding gene | Cytoband: 1p13.2 | ||
| Entrez ID: 10100 | HGNC ID: HGNC:20659 | Ensembl Gene: ENSG00000134198 | OMIM ID: 613133 |
Expression of TSPAN2:
| Dataset | Gene | EntrezID | Probe | Log2FC | Adj.pValue | Expression |
|---|---|---|---|---|---|---|
| GSE17351 | TSPAN2 | 10100 | 227236_at | -1.2571 | 0.2701 | |
| GSE20347 | TSPAN2 | 10100 | 214606_at | 0.0214 | 0.7273 | |
| GSE23400 | TSPAN2 | 10100 | 214606_at | -0.0510 | 0.0140 | |
| GSE26886 | TSPAN2 | 10100 | 227236_at | 1.3011 | 0.0209 | |
| GSE29001 | TSPAN2 | 10100 | 214606_at | 0.0754 | 0.4710 | |
| GSE38129 | TSPAN2 | 10100 | 214606_at | -0.3334 | 0.0586 | |
| GSE45670 | TSPAN2 | 10100 | 227236_at | -2.5477 | 0.0000 | |
| GSE53622 | TSPAN2 | 10100 | 16681 | -1.2073 | 0.0000 | |
| GSE53624 | TSPAN2 | 10100 | 16681 | -1.1658 | 0.0000 | |
| GSE63941 | TSPAN2 | 10100 | 227236_at | -4.4336 | 0.0053 | |
| GSE77861 | TSPAN2 | 10100 | 227236_at | 0.1399 | 0.4791 | |
| GSE97050 | TSPAN2 | 10100 | A_24_P62659 | -1.3153 | 0.1057 | |
| SRP007169 | TSPAN2 | 10100 | RNAseq | 0.6949 | 0.3194 | |
| SRP008496 | TSPAN2 | 10100 | RNAseq | 1.9387 | 0.0013 | |
| SRP064894 | TSPAN2 | 10100 | RNAseq | -0.3424 | 0.2860 | |
| SRP133303 | TSPAN2 | 10100 | RNAseq | -0.4712 | 0.3484 | |
| SRP159526 | TSPAN2 | 10100 | RNAseq | -0.4090 | 0.2849 | |
| SRP193095 | TSPAN2 | 10100 | RNAseq | 0.5798 | 0.1495 | |
| SRP219564 | TSPAN2 | 10100 | RNAseq | -0.3994 | 0.6603 | |
| TCGA | TSPAN2 | 10100 | RNAseq | -0.6080 | 0.0064 |
Upregulated datasets: 2; Downregulated datasets: 4.
Survival by TSPAN2 expression:
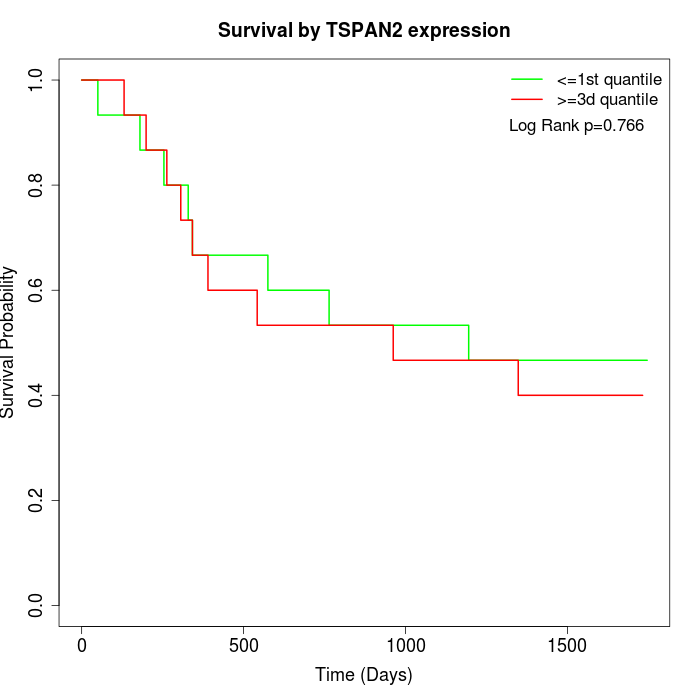 | 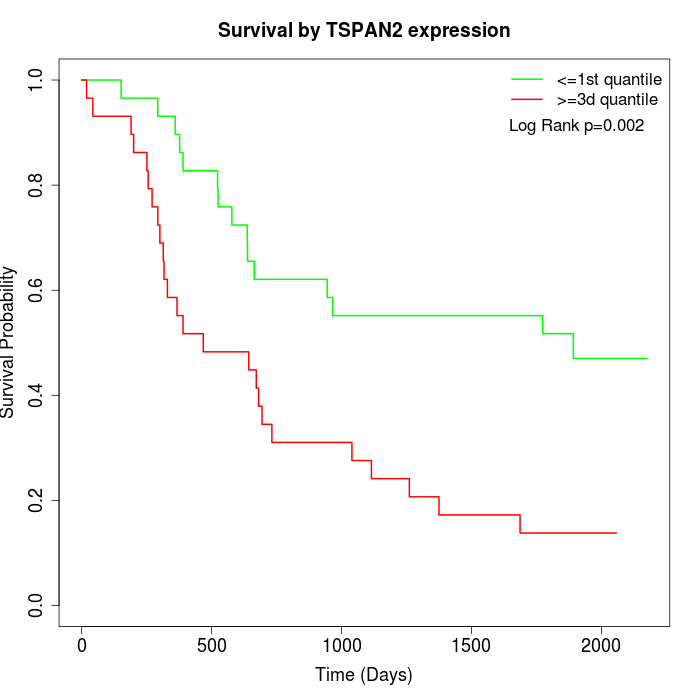 | 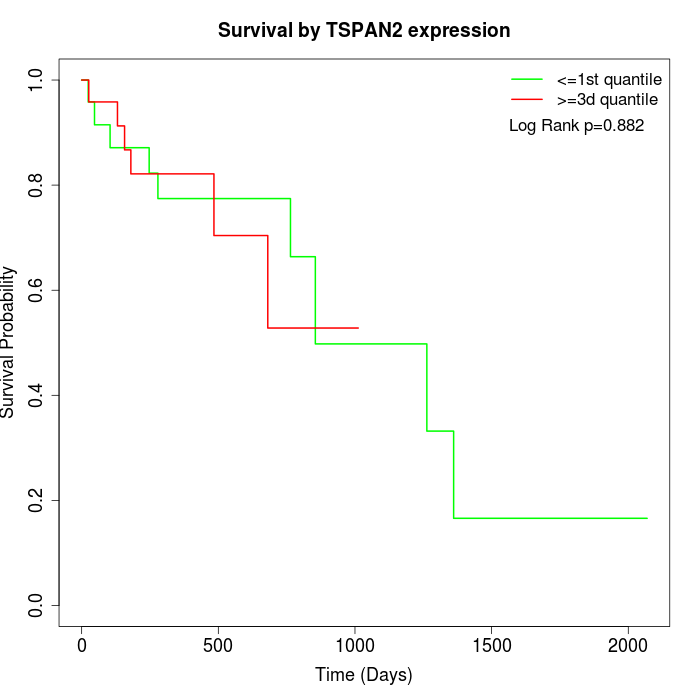 |
| GSE53622 | GSE53624 | TCGA |
Note: Click image to view full size file.
Copy number change of TSPAN2:
| Dataset | Gene | EntrezID | Gain | Loss | Normal | Detail |
|---|---|---|---|---|---|---|
| GSE15526 | TSPAN2 | 10100 | 0 | 9 | 21 | |
| GSE20123 | TSPAN2 | 10100 | 0 | 9 | 21 | |
| GSE43470 | TSPAN2 | 10100 | 0 | 8 | 35 | |
| GSE46452 | TSPAN2 | 10100 | 2 | 1 | 56 | |
| GSE47630 | TSPAN2 | 10100 | 9 | 5 | 26 | |
| GSE54993 | TSPAN2 | 10100 | 0 | 1 | 69 | |
| GSE54994 | TSPAN2 | 10100 | 7 | 3 | 43 | |
| GSE60625 | TSPAN2 | 10100 | 0 | 0 | 11 | |
| GSE74703 | TSPAN2 | 10100 | 0 | 7 | 29 | |
| GSE74704 | TSPAN2 | 10100 | 0 | 5 | 15 | |
| TCGA | TSPAN2 | 10100 | 12 | 29 | 55 |
Total number of gains: 30; Total number of losses: 77; Total Number of normals: 381.
Somatic mutations of TSPAN2:
Generating mutation plots.
Highly correlated genes for TSPAN2:
Showing top 20/1217 corelated genes with mean PCC>0.5.
| Gene1 | Gene2 | Mean PCC | Num. Datasets | Num. PCC<0 | Num. PCC>0.5 |
|---|---|---|---|---|---|
| TSPAN2 | TNFSF12 | 0.802474 | 3 | 0 | 3 |
| TSPAN2 | SORCS1 | 0.799109 | 4 | 0 | 4 |
| TSPAN2 | MRVI1 | 0.787225 | 7 | 0 | 7 |
| TSPAN2 | MSRB3 | 0.784374 | 7 | 0 | 6 |
| TSPAN2 | ILK | 0.780396 | 7 | 0 | 7 |
| TSPAN2 | SLITRK3 | 0.77937 | 7 | 0 | 7 |
| TSPAN2 | AFF3 | 0.777018 | 3 | 0 | 3 |
| TSPAN2 | JAM3 | 0.776739 | 12 | 0 | 12 |
| TSPAN2 | MIR100HG | 0.776702 | 6 | 0 | 6 |
| TSPAN2 | PDE5A | 0.771802 | 9 | 0 | 9 |
| TSPAN2 | ETS2 | 0.769833 | 3 | 0 | 3 |
| TSPAN2 | PDK2 | 0.768688 | 3 | 0 | 3 |
| TSPAN2 | ID4 | 0.768469 | 3 | 0 | 3 |
| TSPAN2 | ARHGAP6 | 0.764103 | 8 | 0 | 8 |
| TSPAN2 | FXYD1 | 0.759634 | 5 | 0 | 5 |
| TSPAN2 | MTURN | 0.759108 | 4 | 0 | 4 |
| TSPAN2 | SGCA | 0.755584 | 8 | 0 | 7 |
| TSPAN2 | RAB9B | 0.754575 | 7 | 0 | 7 |
| TSPAN2 | CYS1 | 0.754189 | 7 | 0 | 7 |
| TSPAN2 | RBPMS2 | 0.75156 | 8 | 0 | 8 |
For details and further investigation, click here