| Full name: tetraspanin 3 | Alias Symbol: TM4-A|TSPAN-3 | ||
| Type: protein-coding gene | Cytoband: 15q24.3 | ||
| Entrez ID: 10099 | HGNC ID: HGNC:17752 | Ensembl Gene: ENSG00000140391 | OMIM ID: 613134 |
Expression of TSPAN3:
| Dataset | Gene | EntrezID | Probe | Log2FC | Adj.pValue | Expression |
|---|---|---|---|---|---|---|
| GSE17351 | TSPAN3 | 10099 | 200972_at | -0.0176 | 0.9813 | |
| GSE20347 | TSPAN3 | 10099 | 200972_at | 0.1052 | 0.5189 | |
| GSE23400 | TSPAN3 | 10099 | 200972_at | 0.2453 | 0.0017 | |
| GSE26886 | TSPAN3 | 10099 | 200972_at | -0.1623 | 0.4981 | |
| GSE29001 | TSPAN3 | 10099 | 200972_at | -0.0919 | 0.7744 | |
| GSE38129 | TSPAN3 | 10099 | 200972_at | 0.1642 | 0.1877 | |
| GSE45670 | TSPAN3 | 10099 | 200972_at | 0.1543 | 0.3029 | |
| GSE53622 | TSPAN3 | 10099 | 109663 | 0.0746 | 0.4632 | |
| GSE53624 | TSPAN3 | 10099 | 109663 | 0.0123 | 0.9147 | |
| GSE63941 | TSPAN3 | 10099 | 200972_at | -0.8257 | 0.1383 | |
| GSE77861 | TSPAN3 | 10099 | 200972_at | 0.1024 | 0.7751 | |
| GSE97050 | TSPAN3 | 10099 | A_23_P14804 | 0.0055 | 0.9815 | |
| SRP007169 | TSPAN3 | 10099 | RNAseq | -0.2117 | 0.6683 | |
| SRP008496 | TSPAN3 | 10099 | RNAseq | -0.3573 | 0.1674 | |
| SRP064894 | TSPAN3 | 10099 | RNAseq | 0.1015 | 0.6500 | |
| SRP133303 | TSPAN3 | 10099 | RNAseq | 0.2732 | 0.1982 | |
| SRP159526 | TSPAN3 | 10099 | RNAseq | 0.4141 | 0.0567 | |
| SRP193095 | TSPAN3 | 10099 | RNAseq | -0.4798 | 0.1144 | |
| SRP219564 | TSPAN3 | 10099 | RNAseq | 0.1253 | 0.7414 | |
| TCGA | TSPAN3 | 10099 | RNAseq | -0.1367 | 0.0013 |
Upregulated datasets: 0; Downregulated datasets: 0.
Survival by TSPAN3 expression:
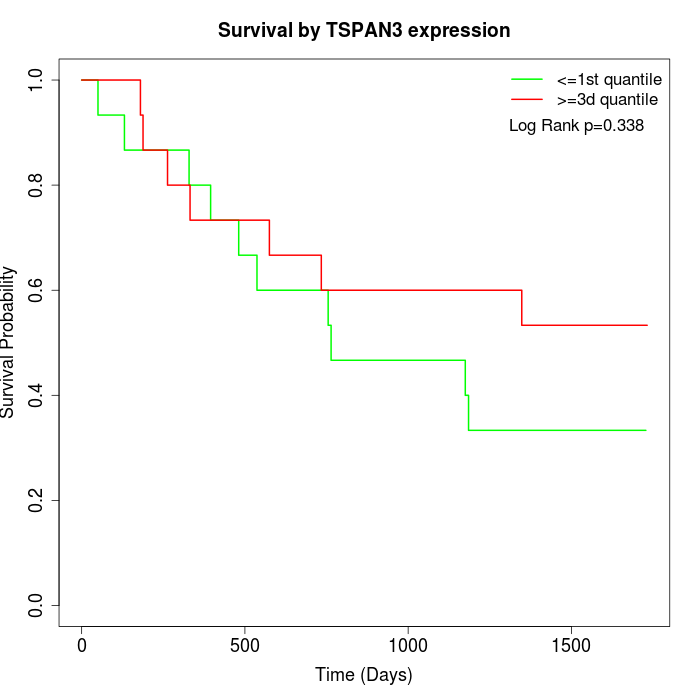 | 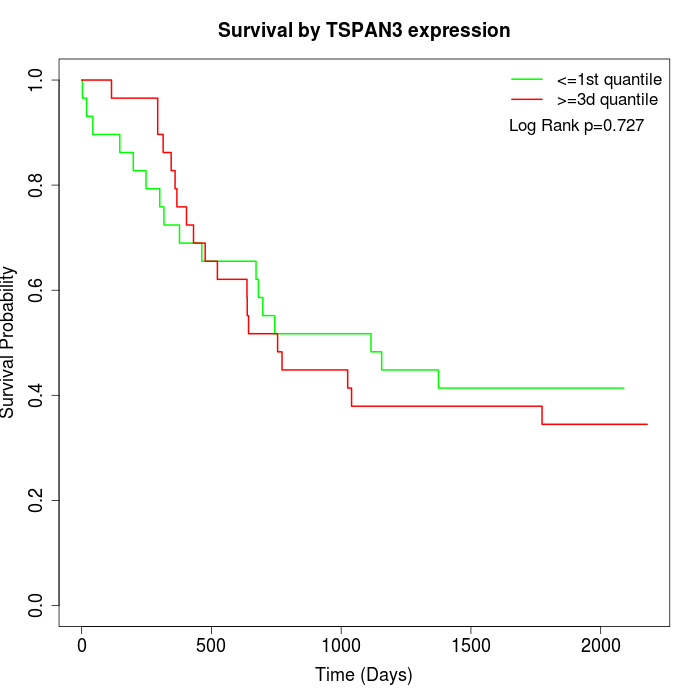 | 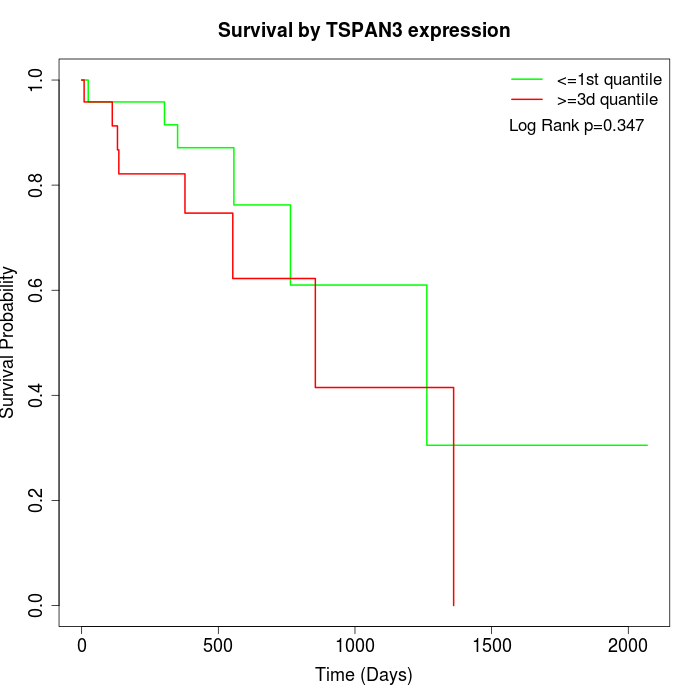 |
| GSE53622 | GSE53624 | TCGA |
Note: Click image to view full size file.
Copy number change of TSPAN3:
| Dataset | Gene | EntrezID | Gain | Loss | Normal | Detail |
|---|---|---|---|---|---|---|
| GSE15526 | TSPAN3 | 10099 | 7 | 2 | 21 | |
| GSE20123 | TSPAN3 | 10099 | 7 | 2 | 21 | |
| GSE43470 | TSPAN3 | 10099 | 4 | 5 | 34 | |
| GSE46452 | TSPAN3 | 10099 | 3 | 7 | 49 | |
| GSE47630 | TSPAN3 | 10099 | 8 | 10 | 22 | |
| GSE54993 | TSPAN3 | 10099 | 5 | 6 | 59 | |
| GSE54994 | TSPAN3 | 10099 | 5 | 6 | 42 | |
| GSE60625 | TSPAN3 | 10099 | 4 | 0 | 7 | |
| GSE74703 | TSPAN3 | 10099 | 4 | 3 | 29 | |
| GSE74704 | TSPAN3 | 10099 | 4 | 2 | 14 | |
| TCGA | TSPAN3 | 10099 | 15 | 15 | 66 |
Total number of gains: 66; Total number of losses: 58; Total Number of normals: 364.
Somatic mutations of TSPAN3:
Generating mutation plots.
Highly correlated genes for TSPAN3:
Showing top 20/251 corelated genes with mean PCC>0.5.
| Gene1 | Gene2 | Mean PCC | Num. Datasets | Num. PCC<0 | Num. PCC>0.5 |
|---|---|---|---|---|---|
| TSPAN3 | ING4 | 0.792101 | 3 | 0 | 3 |
| TSPAN3 | KLHDC10 | 0.780763 | 3 | 0 | 3 |
| TSPAN3 | WARS2 | 0.75704 | 3 | 0 | 3 |
| TSPAN3 | VPS18 | 0.755404 | 3 | 0 | 3 |
| TSPAN3 | ZNF878 | 0.751974 | 3 | 0 | 3 |
| TSPAN3 | ZNF546 | 0.750182 | 3 | 0 | 3 |
| TSPAN3 | TTC17 | 0.748745 | 3 | 0 | 3 |
| TSPAN3 | TNFRSF19 | 0.733802 | 3 | 0 | 3 |
| TSPAN3 | TXNDC16 | 0.716693 | 3 | 0 | 3 |
| TSPAN3 | KCNE3 | 0.714447 | 3 | 0 | 3 |
| TSPAN3 | PPM1L | 0.713482 | 3 | 0 | 3 |
| TSPAN3 | SIKE1 | 0.703394 | 3 | 0 | 3 |
| TSPAN3 | MBD1 | 0.703266 | 3 | 0 | 3 |
| TSPAN3 | ZNF792 | 0.701272 | 4 | 0 | 4 |
| TSPAN3 | TNRC6B | 0.69931 | 3 | 0 | 3 |
| TSPAN3 | TET2 | 0.69849 | 3 | 0 | 3 |
| TSPAN3 | EMB | 0.697823 | 3 | 0 | 3 |
| TSPAN3 | SLC44A4 | 0.696614 | 3 | 0 | 3 |
| TSPAN3 | MSRB2 | 0.692059 | 3 | 0 | 3 |
| TSPAN3 | PPCS | 0.691516 | 3 | 0 | 3 |
For details and further investigation, click here