| Full name: catenin beta 1 | Alias Symbol: beta-catenin|armadillo | ||
| Type: protein-coding gene | Cytoband: 3p22.1 | ||
| Entrez ID: 1499 | HGNC ID: HGNC:2514 | Ensembl Gene: ENSG00000168036 | OMIM ID: 116806 |
| Related drugs: EVEROLIMUS, IMATINIB, LETROZOLE, TEMSIROLIMUS, TRAMETINIB, TRICIRIBINE, VANTICTUMAB... [more] | |||
Screen Evidence:
| |||
CTNNB1 involved pathways:
Expression of CTNNB1:
| Dataset | Gene | EntrezID | Probe | Log2FC | Adj.pValue | Expression |
|---|---|---|---|---|---|---|
| GSE17351 | CTNNB1 | 1499 | 201533_at | 0.0289 | 0.9550 | |
| GSE20347 | CTNNB1 | 1499 | 201533_at | -0.0358 | 0.8069 | |
| GSE23400 | CTNNB1 | 1499 | 201533_at | 0.1168 | 0.2055 | |
| GSE26886 | CTNNB1 | 1499 | 201533_at | -0.5881 | 0.0191 | |
| GSE29001 | CTNNB1 | 1499 | 201533_at | -0.3247 | 0.3179 | |
| GSE38129 | CTNNB1 | 1499 | 201533_at | 0.1648 | 0.1300 | |
| GSE45670 | CTNNB1 | 1499 | 201533_at | 0.0777 | 0.6080 | |
| GSE53622 | CTNNB1 | 1499 | 54779 | -0.0550 | 0.4713 | |
| GSE53624 | CTNNB1 | 1499 | 42125 | -0.0986 | 0.1179 | |
| GSE63941 | CTNNB1 | 1499 | 201533_at | -0.6134 | 0.5969 | |
| GSE77861 | CTNNB1 | 1499 | 201533_at | -0.0965 | 0.7686 | |
| GSE97050 | CTNNB1 | 1499 | A_33_P3421695 | 0.4559 | 0.2601 | |
| SRP007169 | CTNNB1 | 1499 | RNAseq | 0.5620 | 0.1998 | |
| SRP008496 | CTNNB1 | 1499 | RNAseq | 0.5827 | 0.0334 | |
| SRP064894 | CTNNB1 | 1499 | RNAseq | -0.0275 | 0.8416 | |
| SRP133303 | CTNNB1 | 1499 | RNAseq | 0.1173 | 0.1942 | |
| SRP159526 | CTNNB1 | 1499 | RNAseq | 0.4679 | 0.0836 | |
| SRP193095 | CTNNB1 | 1499 | RNAseq | -0.0505 | 0.6685 | |
| SRP219564 | CTNNB1 | 1499 | RNAseq | -0.2104 | 0.2305 | |
| TCGA | CTNNB1 | 1499 | RNAseq | 0.0422 | 0.3264 |
Upregulated datasets: 0; Downregulated datasets: 0.
Survival by CTNNB1 expression:
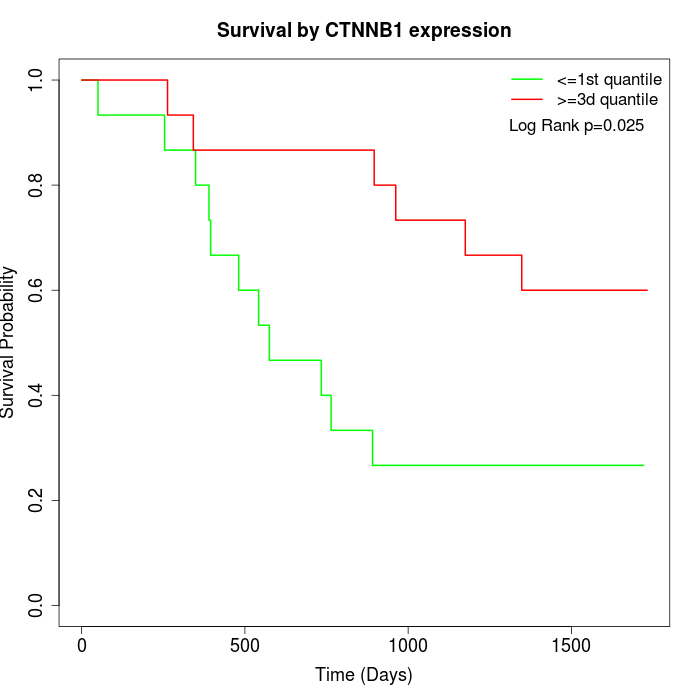 | 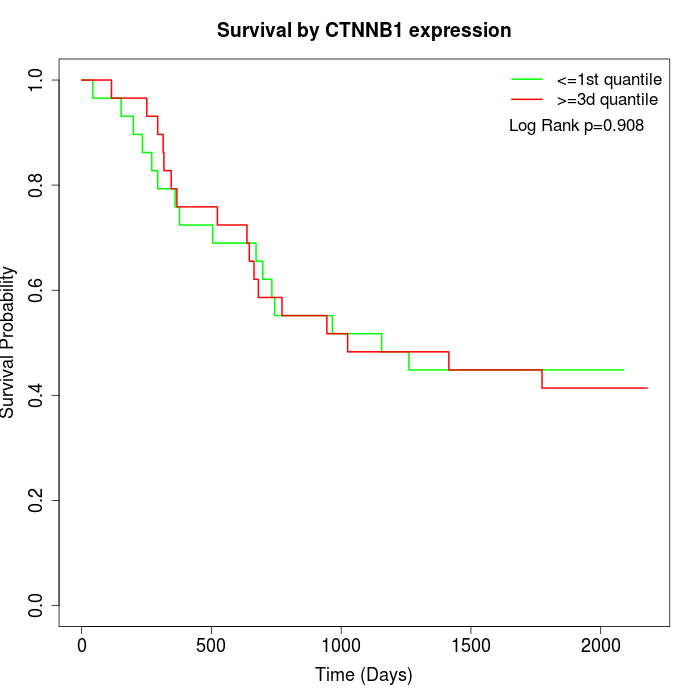 | 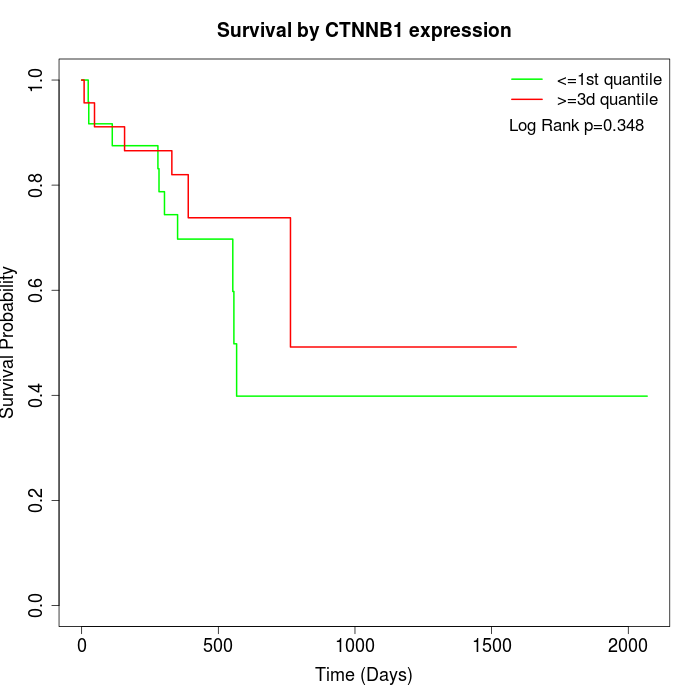 |
| GSE53622 | GSE53624 | TCGA |
Note: Click image to view full size file.
Copy number change of CTNNB1:
| Dataset | Gene | EntrezID | Gain | Loss | Normal | Detail |
|---|---|---|---|---|---|---|
| GSE15526 | CTNNB1 | 1499 | 0 | 19 | 11 | |
| GSE20123 | CTNNB1 | 1499 | 0 | 19 | 11 | |
| GSE43470 | CTNNB1 | 1499 | 0 | 20 | 23 | |
| GSE46452 | CTNNB1 | 1499 | 2 | 17 | 40 | |
| GSE47630 | CTNNB1 | 1499 | 2 | 24 | 14 | |
| GSE54993 | CTNNB1 | 1499 | 7 | 2 | 61 | |
| GSE54994 | CTNNB1 | 1499 | 2 | 32 | 19 | |
| GSE60625 | CTNNB1 | 1499 | 5 | 0 | 6 | |
| GSE74703 | CTNNB1 | 1499 | 0 | 16 | 20 | |
| GSE74704 | CTNNB1 | 1499 | 0 | 13 | 7 | |
| TCGA | CTNNB1 | 1499 | 2 | 71 | 23 |
Total number of gains: 20; Total number of losses: 233; Total Number of normals: 235.
Somatic mutations of CTNNB1:
Generating mutation plots.
Highly correlated genes for CTNNB1:
Showing top 20/50 corelated genes with mean PCC>0.5.
| Gene1 | Gene2 | Mean PCC | Num. Datasets | Num. PCC<0 | Num. PCC>0.5 |
|---|---|---|---|---|---|
| CTNNB1 | WDFY1 | 0.690343 | 3 | 0 | 3 |
| CTNNB1 | APPL1 | 0.645855 | 3 | 0 | 3 |
| CTNNB1 | ADAM10 | 0.642913 | 3 | 0 | 3 |
| CTNNB1 | VTA1 | 0.641101 | 4 | 0 | 3 |
| CTNNB1 | FANCD2 | 0.630737 | 3 | 0 | 3 |
| CTNNB1 | MAP7 | 0.623526 | 5 | 0 | 4 |
| CTNNB1 | CCDC117 | 0.616846 | 4 | 0 | 3 |
| CTNNB1 | CTCF | 0.61672 | 4 | 0 | 4 |
| CTNNB1 | ROBO1 | 0.610148 | 3 | 0 | 3 |
| CTNNB1 | DKK1 | 0.606273 | 4 | 0 | 3 |
| CTNNB1 | ATG3 | 0.596666 | 4 | 0 | 4 |
| CTNNB1 | KIF11 | 0.574388 | 5 | 0 | 3 |
| CTNNB1 | CDV3 | 0.573944 | 6 | 0 | 3 |
| CTNNB1 | ENOPH1 | 0.570857 | 3 | 0 | 3 |
| CTNNB1 | PLIN2 | 0.564236 | 3 | 0 | 3 |
| CTNNB1 | PPM1A | 0.560342 | 4 | 0 | 3 |
| CTNNB1 | RPAP3 | 0.555157 | 5 | 0 | 3 |
| CTNNB1 | APPL2 | 0.553566 | 3 | 0 | 3 |
| CTNNB1 | SNAP23 | 0.552231 | 6 | 0 | 5 |
| CTNNB1 | PDSS2 | 0.54631 | 6 | 0 | 4 |
For details and further investigation, click here