| Full name: zinc finger HIT-type containing 1 | Alias Symbol: CG1I|H_DJ0747G18.14 | ||
| Type: protein-coding gene | Cytoband: 7q22.1 | ||
| Entrez ID: 10467 | HGNC ID: HGNC:21688 | Ensembl Gene: ENSG00000106400 | OMIM ID: |
Screen Evidence:
| |||
Expression of ZNHIT1:
| Dataset | Gene | EntrezID | Probe | Log2FC | Adj.pValue | Expression |
|---|---|---|---|---|---|---|
| GSE17351 | ZNHIT1 | 10467 | 201541_s_at | 0.4224 | 0.3276 | |
| GSE20347 | ZNHIT1 | 10467 | 201541_s_at | 0.0831 | 0.6753 | |
| GSE23400 | ZNHIT1 | 10467 | 201541_s_at | 0.2088 | 0.0053 | |
| GSE26886 | ZNHIT1 | 10467 | 201541_s_at | 0.7110 | 0.0009 | |
| GSE29001 | ZNHIT1 | 10467 | 201541_s_at | 0.0163 | 0.9682 | |
| GSE38129 | ZNHIT1 | 10467 | 201541_s_at | 0.2221 | 0.0873 | |
| GSE45670 | ZNHIT1 | 10467 | 201541_s_at | 0.3355 | 0.0086 | |
| GSE53622 | ZNHIT1 | 10467 | 50999 | 0.2714 | 0.0000 | |
| GSE53624 | ZNHIT1 | 10467 | 50999 | 0.5658 | 0.0000 | |
| GSE63941 | ZNHIT1 | 10467 | 201541_s_at | 0.3866 | 0.4583 | |
| GSE77861 | ZNHIT1 | 10467 | 201541_s_at | -0.0440 | 0.8556 | |
| GSE97050 | ZNHIT1 | 10467 | A_23_P111843 | 0.2147 | 0.3978 | |
| SRP007169 | ZNHIT1 | 10467 | RNAseq | -0.7884 | 0.0231 | |
| SRP008496 | ZNHIT1 | 10467 | RNAseq | -0.4660 | 0.1190 | |
| SRP064894 | ZNHIT1 | 10467 | RNAseq | 0.7188 | 0.0583 | |
| SRP133303 | ZNHIT1 | 10467 | RNAseq | 0.6155 | 0.0015 | |
| SRP159526 | ZNHIT1 | 10467 | RNAseq | 0.0242 | 0.8897 | |
| SRP193095 | ZNHIT1 | 10467 | RNAseq | 0.1802 | 0.2428 | |
| SRP219564 | ZNHIT1 | 10467 | RNAseq | 0.3015 | 0.2951 | |
| TCGA | ZNHIT1 | 10467 | RNAseq | 0.0283 | 0.6127 |
Upregulated datasets: 0; Downregulated datasets: 0.
Survival by ZNHIT1 expression:
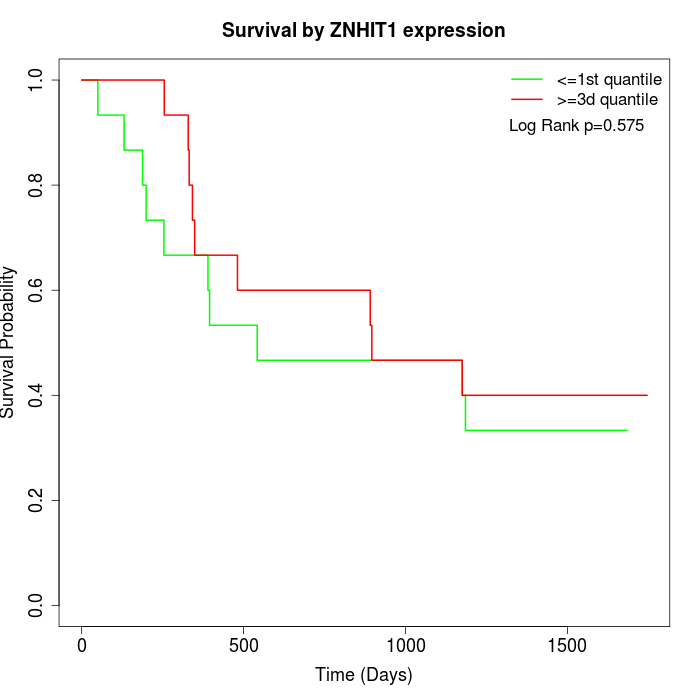 | 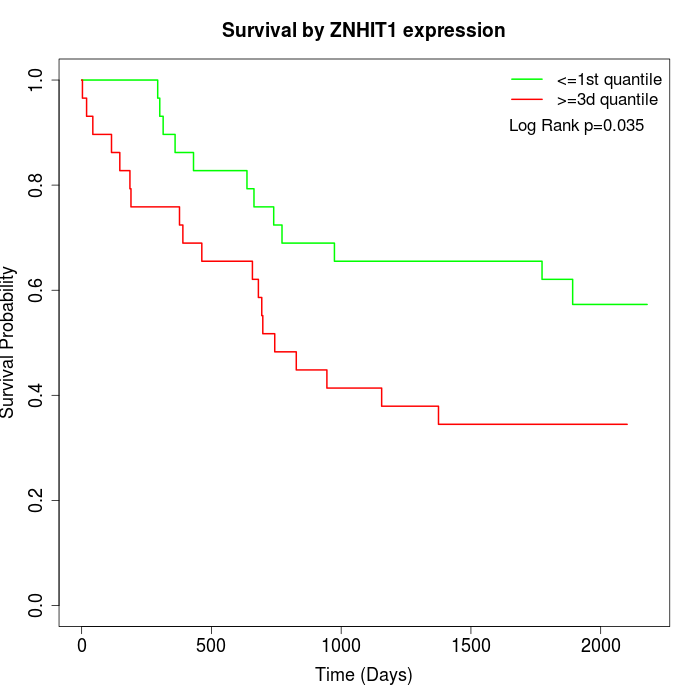 | 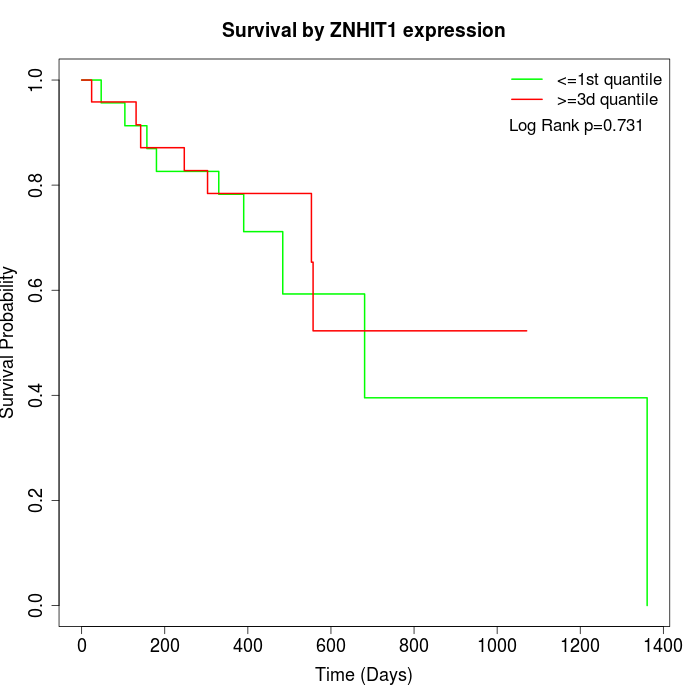 |
| GSE53622 | GSE53624 | TCGA |
Note: Click image to view full size file.
Copy number change of ZNHIT1:
| Dataset | Gene | EntrezID | Gain | Loss | Normal | Detail |
|---|---|---|---|---|---|---|
| GSE15526 | ZNHIT1 | 10467 | 13 | 0 | 17 | |
| GSE20123 | ZNHIT1 | 10467 | 13 | 0 | 17 | |
| GSE43470 | ZNHIT1 | 10467 | 7 | 2 | 34 | |
| GSE46452 | ZNHIT1 | 10467 | 11 | 1 | 47 | |
| GSE47630 | ZNHIT1 | 10467 | 7 | 3 | 30 | |
| GSE54993 | ZNHIT1 | 10467 | 1 | 10 | 59 | |
| GSE54994 | ZNHIT1 | 10467 | 15 | 3 | 35 | |
| GSE60625 | ZNHIT1 | 10467 | 0 | 0 | 11 | |
| GSE74703 | ZNHIT1 | 10467 | 7 | 1 | 28 | |
| GSE74704 | ZNHIT1 | 10467 | 9 | 0 | 11 | |
| TCGA | ZNHIT1 | 10467 | 53 | 6 | 37 |
Total number of gains: 136; Total number of losses: 26; Total Number of normals: 326.
Somatic mutations of ZNHIT1:
Generating mutation plots.
Highly correlated genes for ZNHIT1:
Showing top 20/857 corelated genes with mean PCC>0.5.
| Gene1 | Gene2 | Mean PCC | Num. Datasets | Num. PCC<0 | Num. PCC>0.5 |
|---|---|---|---|---|---|
| ZNHIT1 | SPNS1 | 0.810853 | 3 | 0 | 3 |
| ZNHIT1 | PLEKHM2 | 0.785719 | 3 | 0 | 3 |
| ZNHIT1 | PTCD1 | 0.780977 | 3 | 0 | 3 |
| ZNHIT1 | NFKB1 | 0.759866 | 3 | 0 | 3 |
| ZNHIT1 | LAMTOR4 | 0.754958 | 5 | 0 | 5 |
| ZNHIT1 | ARMC10 | 0.754376 | 8 | 0 | 8 |
| ZNHIT1 | CPT1C | 0.735881 | 3 | 0 | 3 |
| ZNHIT1 | BUD31 | 0.727243 | 11 | 0 | 10 |
| ZNHIT1 | TRIO | 0.724275 | 3 | 0 | 3 |
| ZNHIT1 | NUP188 | 0.721256 | 3 | 0 | 3 |
| ZNHIT1 | POLR2J | 0.709883 | 13 | 0 | 11 |
| ZNHIT1 | NCBP2 | 0.707602 | 3 | 0 | 3 |
| ZNHIT1 | ARFGEF2 | 0.705616 | 3 | 0 | 3 |
| ZNHIT1 | ZFP90 | 0.704624 | 4 | 0 | 3 |
| ZNHIT1 | ARPC1A | 0.704438 | 10 | 0 | 9 |
| ZNHIT1 | STUB1 | 0.703938 | 4 | 0 | 3 |
| ZNHIT1 | PIGU | 0.701636 | 4 | 0 | 3 |
| ZNHIT1 | STK3 | 0.699183 | 3 | 0 | 3 |
| ZNHIT1 | MRPL37 | 0.698068 | 5 | 0 | 4 |
| ZNHIT1 | CENPBD1 | 0.691392 | 4 | 0 | 4 |
For details and further investigation, click here