| Full name: androgen induced 1 | Alias Symbol: dJ95L4.1|AIG-1|FLJ10485 | ||
| Type: protein-coding gene | Cytoband: 6q24.2 | ||
| Entrez ID: 51390 | HGNC ID: HGNC:21607 | Ensembl Gene: ENSG00000146416 | OMIM ID: 608514 |
Expression of AIG1:
| Dataset | Gene | EntrezID | Probe | Log2FC | Adj.pValue | Expression |
|---|---|---|---|---|---|---|
| GSE17351 | AIG1 | 51390 | 223136_at | -0.3328 | 0.5160 | |
| GSE26886 | AIG1 | 51390 | 223136_at | -0.1586 | 0.4970 | |
| GSE45670 | AIG1 | 51390 | 223136_at | -0.3695 | 0.0199 | |
| GSE53622 | AIG1 | 51390 | 2313 | -0.6765 | 0.0000 | |
| GSE53624 | AIG1 | 51390 | 2313 | -0.7066 | 0.0000 | |
| GSE63941 | AIG1 | 51390 | 223136_at | 0.4622 | 0.5244 | |
| GSE77861 | AIG1 | 51390 | 223136_at | -0.6495 | 0.0693 | |
| GSE97050 | AIG1 | 51390 | A_23_P93431 | -0.3921 | 0.2018 | |
| SRP007169 | AIG1 | 51390 | RNAseq | -1.4381 | 0.0007 | |
| SRP008496 | AIG1 | 51390 | RNAseq | -1.3524 | 0.0000 | |
| SRP064894 | AIG1 | 51390 | RNAseq | -0.4231 | 0.0165 | |
| SRP133303 | AIG1 | 51390 | RNAseq | -0.1471 | 0.1085 | |
| SRP159526 | AIG1 | 51390 | RNAseq | -0.4238 | 0.0712 | |
| SRP193095 | AIG1 | 51390 | RNAseq | -0.5315 | 0.0000 | |
| SRP219564 | AIG1 | 51390 | RNAseq | -0.6011 | 0.0251 | |
| TCGA | AIG1 | 51390 | RNAseq | -0.0635 | 0.3436 |
Upregulated datasets: 0; Downregulated datasets: 2.
Survival by AIG1 expression:
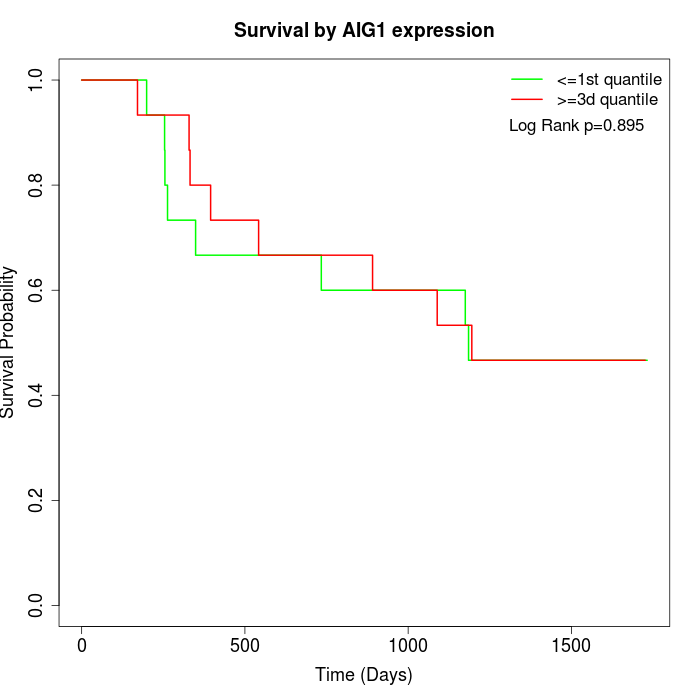 | 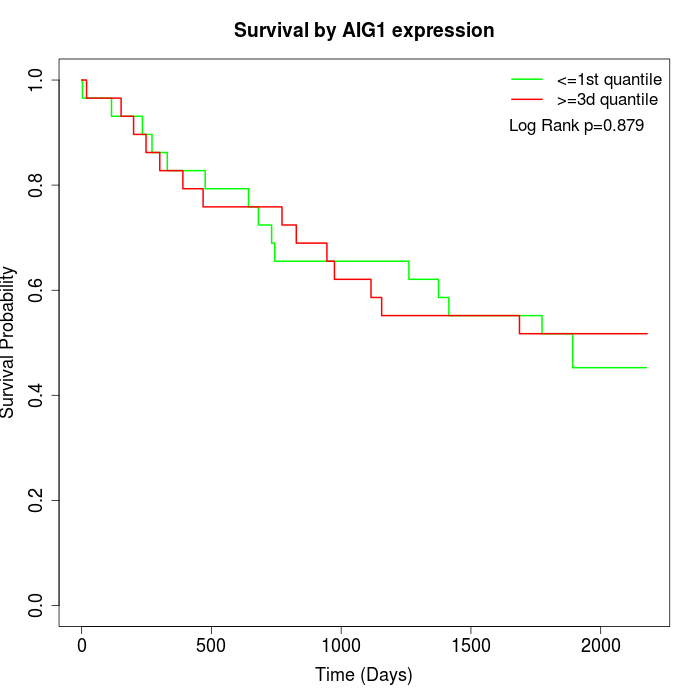 | 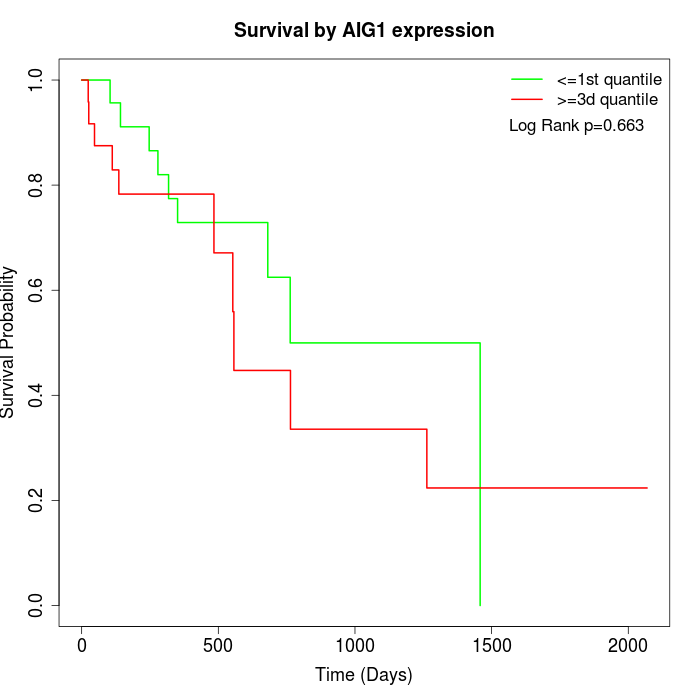 |
| GSE53622 | GSE53624 | TCGA |
Note: Click image to view full size file.
Copy number change of AIG1:
| Dataset | Gene | EntrezID | Gain | Loss | Normal | Detail |
|---|---|---|---|---|---|---|
| GSE15526 | AIG1 | 51390 | 3 | 4 | 23 | |
| GSE20123 | AIG1 | 51390 | 3 | 3 | 24 | |
| GSE43470 | AIG1 | 51390 | 5 | 0 | 38 | |
| GSE46452 | AIG1 | 51390 | 3 | 10 | 46 | |
| GSE47630 | AIG1 | 51390 | 9 | 4 | 27 | |
| GSE54993 | AIG1 | 51390 | 3 | 2 | 65 | |
| GSE54994 | AIG1 | 51390 | 8 | 8 | 37 | |
| GSE60625 | AIG1 | 51390 | 0 | 1 | 10 | |
| GSE74703 | AIG1 | 51390 | 4 | 0 | 32 | |
| GSE74704 | AIG1 | 51390 | 1 | 1 | 18 | |
| TCGA | AIG1 | 51390 | 10 | 20 | 66 |
Total number of gains: 49; Total number of losses: 53; Total Number of normals: 386.
Somatic mutations of AIG1:
Generating mutation plots.
Highly correlated genes for AIG1:
Showing top 20/611 corelated genes with mean PCC>0.5.
| Gene1 | Gene2 | Mean PCC | Num. Datasets | Num. PCC<0 | Num. PCC>0.5 |
|---|---|---|---|---|---|
| AIG1 | PLAGL1 | 0.716483 | 4 | 0 | 4 |
| AIG1 | MPP7 | 0.711797 | 5 | 0 | 5 |
| AIG1 | FBXO10 | 0.701745 | 3 | 0 | 3 |
| AIG1 | LMBRD1 | 0.693587 | 5 | 0 | 5 |
| AIG1 | RAB5B | 0.691311 | 5 | 0 | 5 |
| AIG1 | CWC27 | 0.687786 | 4 | 0 | 3 |
| AIG1 | CXCR2 | 0.677017 | 4 | 0 | 4 |
| AIG1 | CYP1A2 | 0.666744 | 3 | 0 | 3 |
| AIG1 | SETD6 | 0.665339 | 3 | 0 | 3 |
| AIG1 | FAM200B | 0.660682 | 3 | 0 | 3 |
| AIG1 | RWDD2B | 0.658959 | 3 | 0 | 3 |
| AIG1 | RSPH3 | 0.657922 | 5 | 0 | 4 |
| AIG1 | ANXA11 | 0.654411 | 5 | 0 | 5 |
| AIG1 | SORT1 | 0.653539 | 5 | 0 | 5 |
| AIG1 | KAT2B | 0.653069 | 5 | 0 | 5 |
| AIG1 | CNOT6 | 0.651724 | 4 | 0 | 3 |
| AIG1 | DUSP22 | 0.650894 | 4 | 0 | 4 |
| AIG1 | TMEM38A | 0.649605 | 4 | 0 | 3 |
| AIG1 | ECHDC2 | 0.649401 | 5 | 0 | 5 |
| AIG1 | PMVK | 0.648665 | 6 | 0 | 5 |
For details and further investigation, click here