| Full name: achaete-scute family bHLH transcription factor 1 | Alias Symbol: ASH1|HASH1|bHLHa46 | ||
| Type: protein-coding gene | Cytoband: 12q23.2 | ||
| Entrez ID: 429 | HGNC ID: HGNC:738 | Ensembl Gene: ENSG00000139352 | OMIM ID: 100790 |
Screen Evidence:
| |||
Expression of ASCL1:
| Dataset | Gene | EntrezID | Probe | Log2FC | Adj.pValue | Expression |
|---|---|---|---|---|---|---|
| GSE17351 | ASCL1 | 429 | 213768_s_at | 0.0272 | 0.9284 | |
| GSE20347 | ASCL1 | 429 | 209985_s_at | -0.0564 | 0.5296 | |
| GSE23400 | ASCL1 | 429 | 213768_s_at | -0.1212 | 0.0037 | |
| GSE26886 | ASCL1 | 429 | 209985_s_at | 0.0485 | 0.7146 | |
| GSE29001 | ASCL1 | 429 | 213768_s_at | -0.2196 | 0.1319 | |
| GSE38129 | ASCL1 | 429 | 209985_s_at | 0.0114 | 0.9497 | |
| GSE45670 | ASCL1 | 429 | 213768_s_at | 0.1437 | 0.0996 | |
| GSE53622 | ASCL1 | 429 | 94965 | 0.7168 | 0.0000 | |
| GSE53624 | ASCL1 | 429 | 94965 | 1.0097 | 0.0000 | |
| GSE63941 | ASCL1 | 429 | 213768_s_at | -0.0168 | 0.9465 | |
| GSE77861 | ASCL1 | 429 | 213768_s_at | 0.0130 | 0.9413 | |
| GSE97050 | ASCL1 | 429 | A_23_P25305 | 0.3016 | 0.2232 | |
| TCGA | ASCL1 | 429 | RNAseq | -1.2049 | 0.1078 |
Upregulated datasets: 1; Downregulated datasets: 0.
Survival by ASCL1 expression:
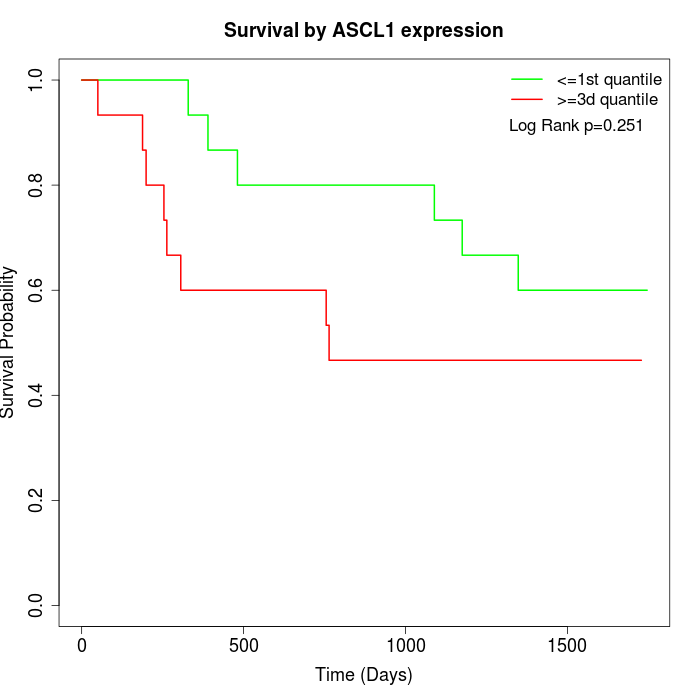 | 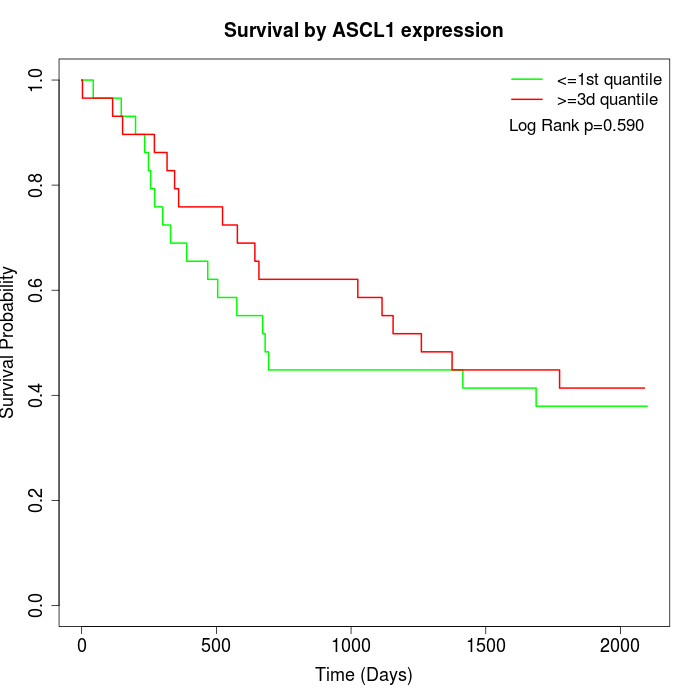 | 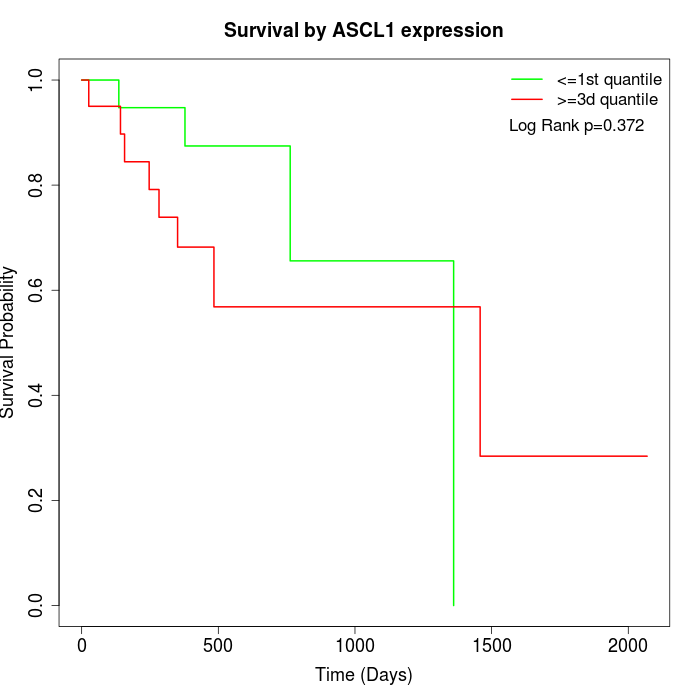 |
| GSE53622 | GSE53624 | TCGA |
Note: Click image to view full size file.
Copy number change of ASCL1:
| Dataset | Gene | EntrezID | Gain | Loss | Normal | Detail |
|---|---|---|---|---|---|---|
| GSE15526 | ASCL1 | 429 | 3 | 2 | 25 | |
| GSE20123 | ASCL1 | 429 | 3 | 2 | 25 | |
| GSE43470 | ASCL1 | 429 | 2 | 0 | 41 | |
| GSE46452 | ASCL1 | 429 | 9 | 1 | 49 | |
| GSE47630 | ASCL1 | 429 | 9 | 1 | 30 | |
| GSE54993 | ASCL1 | 429 | 0 | 5 | 65 | |
| GSE54994 | ASCL1 | 429 | 4 | 2 | 47 | |
| GSE60625 | ASCL1 | 429 | 0 | 0 | 11 | |
| GSE74703 | ASCL1 | 429 | 2 | 0 | 34 | |
| GSE74704 | ASCL1 | 429 | 1 | 2 | 17 | |
| TCGA | ASCL1 | 429 | 19 | 10 | 67 |
Total number of gains: 52; Total number of losses: 25; Total Number of normals: 411.
Somatic mutations of ASCL1:
Generating mutation plots.
Highly correlated genes for ASCL1:
Showing top 20/498 corelated genes with mean PCC>0.5.
| Gene1 | Gene2 | Mean PCC | Num. Datasets | Num. PCC<0 | Num. PCC>0.5 |
|---|---|---|---|---|---|
| ASCL1 | MTTP | 0.738521 | 4 | 0 | 4 |
| ASCL1 | AMHR2 | 0.734328 | 4 | 0 | 4 |
| ASCL1 | UTF1 | 0.718074 | 3 | 0 | 3 |
| ASCL1 | CRYGA | 0.714359 | 3 | 0 | 3 |
| ASCL1 | NDOR1 | 0.690487 | 3 | 0 | 3 |
| ASCL1 | CLCF1 | 0.688981 | 3 | 0 | 3 |
| ASCL1 | FAM163A | 0.683911 | 4 | 0 | 4 |
| ASCL1 | GRK6 | 0.674521 | 3 | 0 | 3 |
| ASCL1 | IFNA4 | 0.67027 | 3 | 0 | 3 |
| ASCL1 | AQP2 | 0.668441 | 3 | 0 | 3 |
| ASCL1 | CYP19A1 | 0.664145 | 4 | 0 | 4 |
| ASCL1 | SLC12A3 | 0.662392 | 4 | 0 | 3 |
| ASCL1 | DEFA4 | 0.662366 | 3 | 0 | 3 |
| ASCL1 | FGF6 | 0.662359 | 3 | 0 | 3 |
| ASCL1 | TMEM190 | 0.662011 | 3 | 0 | 3 |
| ASCL1 | HTR3A | 0.659827 | 3 | 0 | 3 |
| ASCL1 | SEMA6B | 0.659295 | 3 | 0 | 3 |
| ASCL1 | MYO1A | 0.658175 | 3 | 0 | 3 |
| ASCL1 | CD79A | 0.658056 | 5 | 0 | 4 |
| ASCL1 | CD5L | 0.656976 | 3 | 0 | 3 |
For details and further investigation, click here