| Full name: carbonic anhydrase 2 | Alias Symbol: Car2|CA-II|CAII | ||
| Type: protein-coding gene | Cytoband: 8q21.2 | ||
| Entrez ID: 760 | HGNC ID: HGNC:1373 | Ensembl Gene: ENSG00000104267 | OMIM ID: 611492 |
| Related drugs: ACETAZOLAMIDE, ACETAZOLAMIDE SODIUM, BENZTHIAZIDE, BRINZOLAMIDE, CHLOROTHIAZIDE, CYCLOTHIAZIDE, DICHLORPHENAMIDE, DORZOLAMIDE, DORZOLAMIDE HYDROCHLORIDE, EPOETIN ALFA... [more] | |||
Expression of CA2:
| Dataset | Gene | EntrezID | Probe | Log2FC | Adj.pValue | Expression |
|---|---|---|---|---|---|---|
| GSE17351 | CA2 | 760 | 209301_at | 0.6846 | 0.8182 | |
| GSE20347 | CA2 | 760 | 209301_at | 0.2192 | 0.7573 | |
| GSE23400 | CA2 | 760 | 209301_at | 0.7737 | 0.0173 | |
| GSE26886 | CA2 | 760 | 209301_at | -1.3963 | 0.0068 | |
| GSE29001 | CA2 | 760 | 209301_at | 0.7116 | 0.3747 | |
| GSE38129 | CA2 | 760 | 209301_at | 0.4153 | 0.4830 | |
| GSE45670 | CA2 | 760 | 209301_at | 2.1556 | 0.0002 | |
| GSE53622 | CA2 | 760 | 145023 | 0.6915 | 0.0081 | |
| GSE53624 | CA2 | 760 | 145023 | 0.2214 | 0.2356 | |
| GSE63941 | CA2 | 760 | 209301_at | 3.6742 | 0.1110 | |
| GSE77861 | CA2 | 760 | 209301_at | -0.5934 | 0.3740 | |
| GSE97050 | CA2 | 760 | A_23_P8913 | 0.7195 | 0.2307 | |
| SRP007169 | CA2 | 760 | RNAseq | -0.3443 | 0.5318 | |
| SRP008496 | CA2 | 760 | RNAseq | 0.1587 | 0.8327 | |
| SRP064894 | CA2 | 760 | RNAseq | 1.7062 | 0.0003 | |
| SRP133303 | CA2 | 760 | RNAseq | 1.1127 | 0.0132 | |
| SRP159526 | CA2 | 760 | RNAseq | -1.2961 | 0.0031 | |
| SRP193095 | CA2 | 760 | RNAseq | -1.7358 | 0.0022 | |
| SRP219564 | CA2 | 760 | RNAseq | -0.5511 | 0.5790 | |
| TCGA | CA2 | 760 | RNAseq | -0.7513 | 0.0007 |
Upregulated datasets: 3; Downregulated datasets: 3.
Survival by CA2 expression:
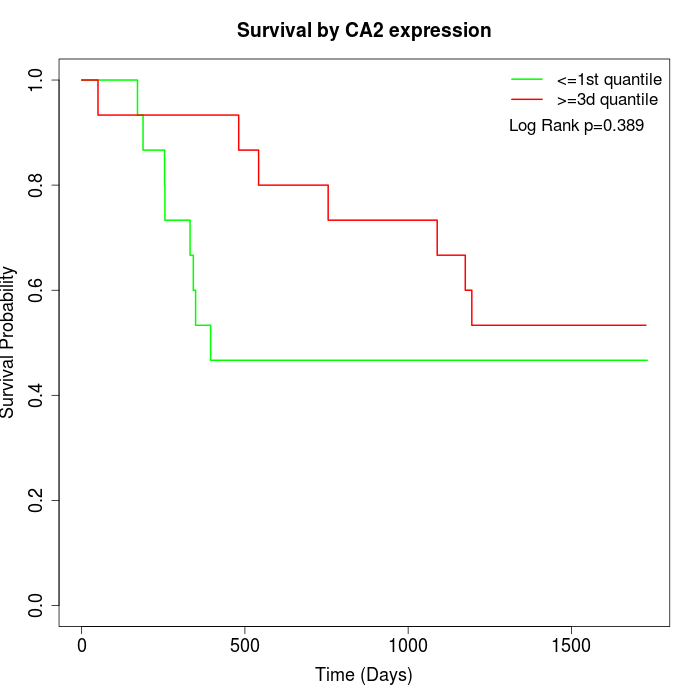 | 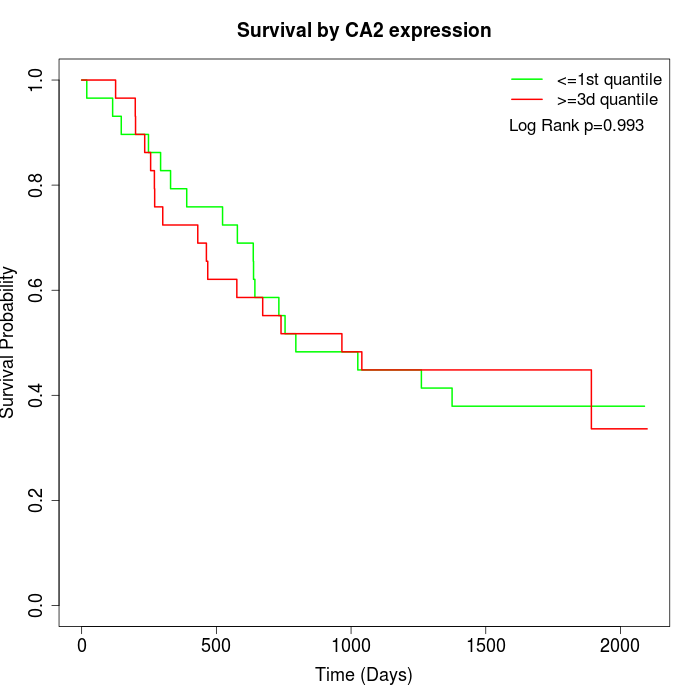 |  |
| GSE53622 | GSE53624 | TCGA |
Note: Click image to view full size file.
Copy number change of CA2:
| Dataset | Gene | EntrezID | Gain | Loss | Normal | Detail |
|---|---|---|---|---|---|---|
| GSE15526 | CA2 | 760 | 13 | 2 | 15 | |
| GSE20123 | CA2 | 760 | 15 | 2 | 13 | |
| GSE43470 | CA2 | 760 | 18 | 1 | 24 | |
| GSE46452 | CA2 | 760 | 21 | 0 | 38 | |
| GSE47630 | CA2 | 760 | 23 | 0 | 17 | |
| GSE54993 | CA2 | 760 | 0 | 19 | 51 | |
| GSE54994 | CA2 | 760 | 32 | 1 | 20 | |
| GSE60625 | CA2 | 760 | 0 | 4 | 7 | |
| GSE74703 | CA2 | 760 | 15 | 1 | 20 | |
| GSE74704 | CA2 | 760 | 10 | 0 | 10 | |
| TCGA | CA2 | 760 | 54 | 2 | 40 |
Total number of gains: 201; Total number of losses: 32; Total Number of normals: 255.
Somatic mutations of CA2:
Generating mutation plots.
Highly correlated genes for CA2:
Showing top 20/88 corelated genes with mean PCC>0.5.
| Gene1 | Gene2 | Mean PCC | Num. Datasets | Num. PCC<0 | Num. PCC>0.5 |
|---|---|---|---|---|---|
| CA2 | BRI3BP | 0.663172 | 3 | 0 | 3 |
| CA2 | NIPAL4 | 0.646888 | 4 | 0 | 3 |
| CA2 | GSDMC | 0.642363 | 4 | 0 | 4 |
| CA2 | IL1RN | 0.637528 | 3 | 0 | 3 |
| CA2 | MYO10 | 0.614584 | 5 | 0 | 3 |
| CA2 | HMGCR | 0.609736 | 3 | 0 | 3 |
| CA2 | DSPP | 0.609317 | 3 | 0 | 3 |
| CA2 | RNPEP | 0.607187 | 3 | 0 | 3 |
| CA2 | PPP1R14C | 0.603222 | 5 | 0 | 5 |
| CA2 | XDH | 0.602824 | 5 | 0 | 4 |
| CA2 | SLC7A1 | 0.602189 | 3 | 0 | 3 |
| CA2 | GJB2 | 0.590241 | 6 | 0 | 4 |
| CA2 | EPHB2 | 0.590037 | 4 | 0 | 4 |
| CA2 | LY6D | 0.58731 | 5 | 0 | 4 |
| CA2 | GM2A | 0.583529 | 6 | 0 | 4 |
| CA2 | CASP14 | 0.58317 | 4 | 0 | 3 |
| CA2 | TMEM167A | 0.577819 | 4 | 0 | 3 |
| CA2 | SERPINB3 | 0.576892 | 4 | 0 | 3 |
| CA2 | CLCA2 | 0.576174 | 6 | 0 | 4 |
| CA2 | DTWD2 | 0.57134 | 4 | 0 | 3 |
For details and further investigation, click here