| Full name: signal transducer and activator of transcription 4 | Alias Symbol: | ||
| Type: protein-coding gene | Cytoband: 2q32.2-q32.3 | ||
| Entrez ID: 6775 | HGNC ID: HGNC:11365 | Ensembl Gene: ENSG00000138378 | OMIM ID: 600558 |
| Related drugs: LISOFYLLINE, PROXYPHYLLINE... [more] | |||
STAT4 involved pathways:
| KEGG pathway | Description | View |
|---|---|---|
| hsa04630 | Jak-STAT signaling pathway | |
| hsa05161 | Hepatitis B | |
| hsa05321 | Inflammatory bowel disease (IBD) |
Expression of STAT4:
| Dataset | Gene | EntrezID | Probe | Log2FC | Adj.pValue | Expression |
|---|---|---|---|---|---|---|
| GSE17351 | STAT4 | 6775 | 206118_at | 0.5699 | 0.3626 | |
| GSE20347 | STAT4 | 6775 | 206118_at | 0.0491 | 0.7116 | |
| GSE23400 | STAT4 | 6775 | 206118_at | 0.0382 | 0.5288 | |
| GSE26886 | STAT4 | 6775 | 206118_at | 0.3494 | 0.2920 | |
| GSE29001 | STAT4 | 6775 | 206118_at | 0.0487 | 0.8142 | |
| GSE38129 | STAT4 | 6775 | 206118_at | -0.0603 | 0.6705 | |
| GSE45670 | STAT4 | 6775 | 206118_at | 0.1507 | 0.5776 | |
| GSE53622 | STAT4 | 6775 | 103085 | 0.3104 | 0.0230 | |
| GSE53624 | STAT4 | 6775 | 103085 | 0.1457 | 0.3082 | |
| GSE63941 | STAT4 | 6775 | 206118_at | 0.3868 | 0.5959 | |
| GSE77861 | STAT4 | 6775 | 206118_at | 0.1549 | 0.3105 | |
| GSE97050 | STAT4 | 6775 | A_23_P68031 | 0.5494 | 0.2104 | |
| SRP007169 | STAT4 | 6775 | RNAseq | 0.4548 | 0.4805 | |
| SRP064894 | STAT4 | 6775 | RNAseq | 0.9818 | 0.0003 | |
| SRP133303 | STAT4 | 6775 | RNAseq | 0.9817 | 0.0053 | |
| SRP159526 | STAT4 | 6775 | RNAseq | -0.0274 | 0.9643 | |
| SRP193095 | STAT4 | 6775 | RNAseq | 0.2881 | 0.1652 | |
| SRP219564 | STAT4 | 6775 | RNAseq | 0.3953 | 0.2347 | |
| TCGA | STAT4 | 6775 | RNAseq | 0.2013 | 0.3155 |
Upregulated datasets: 0; Downregulated datasets: 0.
Survival by STAT4 expression:
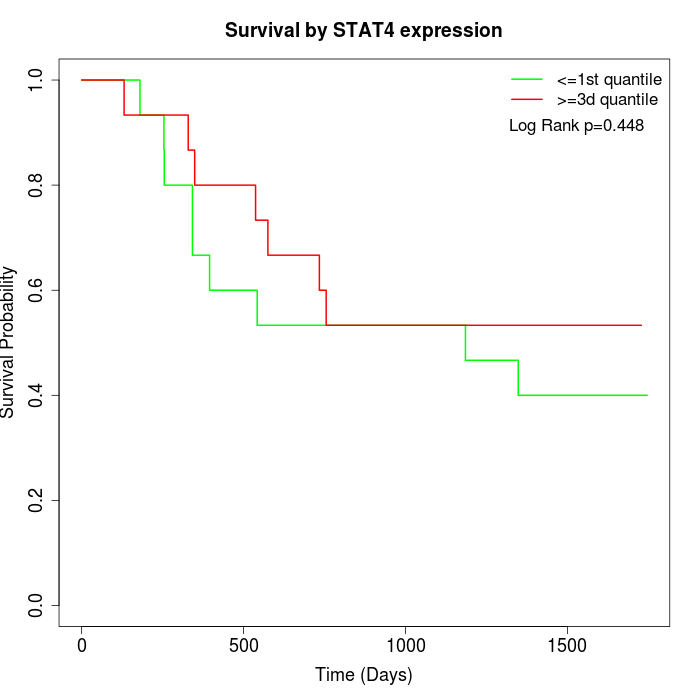 | 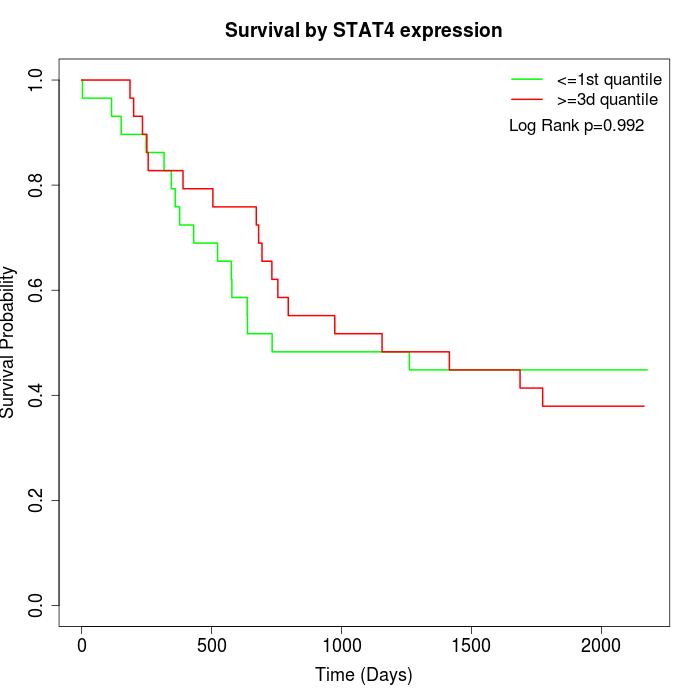 | 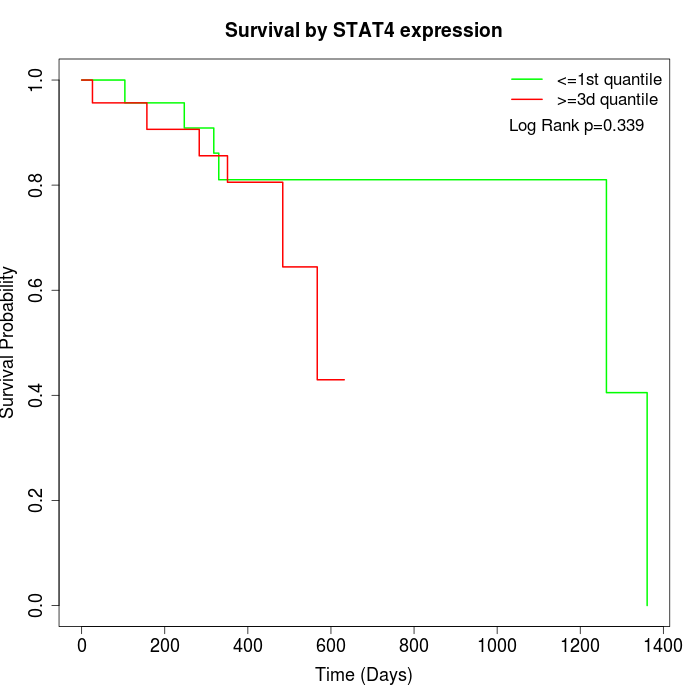 |
| GSE53622 | GSE53624 | TCGA |
Note: Click image to view full size file.
Copy number change of STAT4:
| Dataset | Gene | EntrezID | Gain | Loss | Normal | Detail |
|---|---|---|---|---|---|---|
| GSE15526 | STAT4 | 6775 | 8 | 2 | 20 | |
| GSE20123 | STAT4 | 6775 | 8 | 2 | 20 | |
| GSE43470 | STAT4 | 6775 | 3 | 1 | 39 | |
| GSE46452 | STAT4 | 6775 | 1 | 4 | 54 | |
| GSE47630 | STAT4 | 6775 | 4 | 5 | 31 | |
| GSE54993 | STAT4 | 6775 | 0 | 5 | 65 | |
| GSE54994 | STAT4 | 6775 | 12 | 6 | 35 | |
| GSE60625 | STAT4 | 6775 | 0 | 3 | 8 | |
| GSE74703 | STAT4 | 6775 | 2 | 1 | 33 | |
| GSE74704 | STAT4 | 6775 | 3 | 2 | 15 | |
| TCGA | STAT4 | 6775 | 24 | 8 | 64 |
Total number of gains: 65; Total number of losses: 39; Total Number of normals: 384.
Somatic mutations of STAT4:
Generating mutation plots.
Highly correlated genes for STAT4:
Showing top 20/171 corelated genes with mean PCC>0.5.
| Gene1 | Gene2 | Mean PCC | Num. Datasets | Num. PCC<0 | Num. PCC>0.5 |
|---|---|---|---|---|---|
| STAT4 | CA9 | 0.760527 | 3 | 0 | 3 |
| STAT4 | INPP5F | 0.698569 | 3 | 0 | 3 |
| STAT4 | RECQL4 | 0.678416 | 3 | 0 | 3 |
| STAT4 | SFMBT2 | 0.642023 | 4 | 0 | 3 |
| STAT4 | CFB | 0.637631 | 6 | 0 | 5 |
| STAT4 | PDIA2 | 0.635283 | 3 | 0 | 3 |
| STAT4 | PEX16 | 0.631526 | 3 | 0 | 3 |
| STAT4 | PREX1 | 0.630834 | 4 | 0 | 3 |
| STAT4 | CBX3 | 0.627258 | 3 | 0 | 3 |
| STAT4 | LAIR1 | 0.625146 | 6 | 0 | 5 |
| STAT4 | FERMT3 | 0.621567 | 5 | 0 | 4 |
| STAT4 | AKNA | 0.620652 | 6 | 0 | 4 |
| STAT4 | SIPA1L3 | 0.620065 | 3 | 0 | 3 |
| STAT4 | TNFSF13B | 0.619053 | 8 | 0 | 7 |
| STAT4 | CD4 | 0.618156 | 6 | 0 | 5 |
| STAT4 | CCL4 | 0.617737 | 7 | 0 | 7 |
| STAT4 | SPATA13 | 0.610074 | 4 | 0 | 3 |
| STAT4 | CRTAM | 0.606302 | 5 | 0 | 3 |
| STAT4 | SAMSN1 | 0.6041 | 8 | 0 | 7 |
| STAT4 | BCAT1 | 0.6039 | 4 | 0 | 3 |
For details and further investigation, click here