| Full name: cell adhesion molecule 2 | Alias Symbol: NECL3|Necl-3|SynCAM2 | ||
| Type: protein-coding gene | Cytoband: 3p12.1 | ||
| Entrez ID: 253559 | HGNC ID: HGNC:29849 | Ensembl Gene: ENSG00000175161 | OMIM ID: 609938 |
Expression of CADM2:
| Dataset | Gene | EntrezID | Probe | Log2FC | Adj.pValue | Expression |
|---|---|---|---|---|---|---|
| GSE17351 | CADM2 | 253559 | 1552752_a_at | -0.1015 | 0.8405 | |
| GSE26886 | CADM2 | 253559 | 1555544_a_at | -0.0701 | 0.5849 | |
| GSE45670 | CADM2 | 253559 | 1552752_a_at | -0.0715 | 0.3790 | |
| GSE53622 | CADM2 | 253559 | 125184 | -3.1065 | 0.0000 | |
| GSE53624 | CADM2 | 253559 | 125184 | -2.2741 | 0.0000 | |
| GSE63941 | CADM2 | 253559 | 1555544_a_at | 0.0117 | 0.9735 | |
| GSE77861 | CADM2 | 253559 | 1555544_a_at | -0.1679 | 0.2922 | |
| GSE97050 | CADM2 | 253559 | A_33_P3353210 | -1.6908 | 0.1301 | |
| SRP064894 | CADM2 | 253559 | RNAseq | -0.6260 | 0.2567 | |
| SRP133303 | CADM2 | 253559 | RNAseq | -2.4096 | 0.0000 | |
| SRP159526 | CADM2 | 253559 | RNAseq | -1.5142 | 0.0108 | |
| SRP219564 | CADM2 | 253559 | RNAseq | -0.7245 | 0.4820 | |
| TCGA | CADM2 | 253559 | RNAseq | -2.8413 | 0.0000 |
Upregulated datasets: 0; Downregulated datasets: 5.
Survival by CADM2 expression:
 | 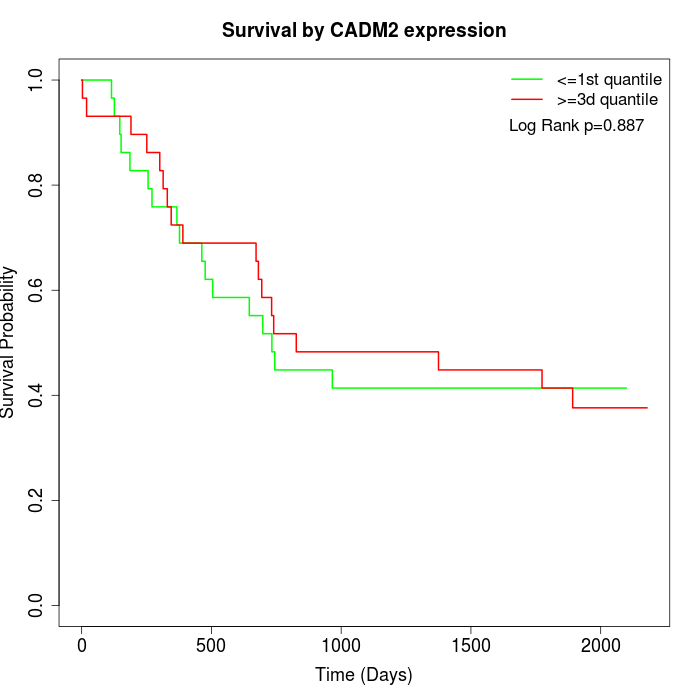 | 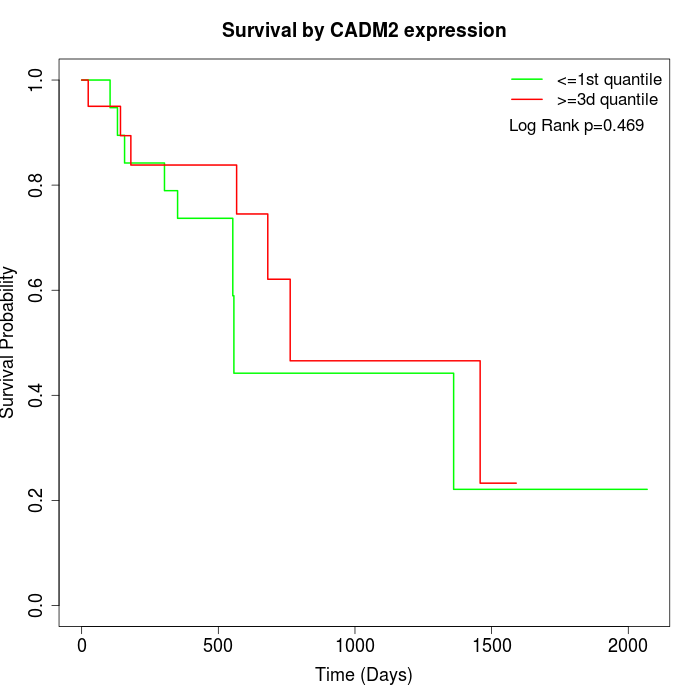 |
| GSE53622 | GSE53624 | TCGA |
Note: Click image to view full size file.
Copy number change of CADM2:
| Dataset | Gene | EntrezID | Gain | Loss | Normal | Detail |
|---|---|---|---|---|---|---|
| GSE15526 | CADM2 | 253559 | 4 | 18 | 8 | |
| GSE20123 | CADM2 | 253559 | 4 | 18 | 8 | |
| GSE43470 | CADM2 | 253559 | 1 | 22 | 20 | |
| GSE46452 | CADM2 | 253559 | 2 | 17 | 40 | |
| GSE47630 | CADM2 | 253559 | 4 | 18 | 18 | |
| GSE54993 | CADM2 | 253559 | 4 | 3 | 63 | |
| GSE54994 | CADM2 | 253559 | 3 | 27 | 23 | |
| GSE60625 | CADM2 | 253559 | 0 | 6 | 5 | |
| GSE74703 | CADM2 | 253559 | 1 | 20 | 15 | |
| GSE74704 | CADM2 | 253559 | 3 | 13 | 4 | |
| TCGA | CADM2 | 253559 | 4 | 73 | 19 |
Total number of gains: 30; Total number of losses: 235; Total Number of normals: 223.
Somatic mutations of CADM2:
Generating mutation plots.
Highly correlated genes for CADM2:
Showing top 20/658 corelated genes with mean PCC>0.5.
| Gene1 | Gene2 | Mean PCC | Num. Datasets | Num. PCC<0 | Num. PCC>0.5 |
|---|---|---|---|---|---|
| CADM2 | CYP21A2 | 0.858778 | 3 | 0 | 3 |
| CADM2 | SORCS1 | 0.844579 | 4 | 0 | 4 |
| CADM2 | SLITRK3 | 0.833916 | 3 | 0 | 3 |
| CADM2 | XKR4 | 0.828745 | 4 | 0 | 4 |
| CADM2 | PLAC9 | 0.815437 | 4 | 0 | 4 |
| CADM2 | RBFOX3 | 0.804762 | 3 | 0 | 3 |
| CADM2 | ANO5 | 0.80435 | 4 | 0 | 4 |
| CADM2 | CLEC3B | 0.803265 | 3 | 0 | 3 |
| CADM2 | ANKS1A | 0.800103 | 3 | 0 | 3 |
| CADM2 | ATP1B2 | 0.79847 | 3 | 0 | 3 |
| CADM2 | CAB39L | 0.784929 | 3 | 0 | 3 |
| CADM2 | BHMT2 | 0.781171 | 4 | 0 | 4 |
| CADM2 | PGR | 0.778807 | 4 | 0 | 4 |
| CADM2 | PYGM | 0.777631 | 5 | 0 | 5 |
| CADM2 | CTNNA3 | 0.776823 | 5 | 0 | 5 |
| CADM2 | TNXB | 0.769885 | 3 | 0 | 3 |
| CADM2 | AR | 0.769753 | 3 | 0 | 3 |
| CADM2 | SEMA3E | 0.768687 | 3 | 0 | 3 |
| CADM2 | SH3BGR | 0.765211 | 4 | 0 | 4 |
| CADM2 | TCEAL2 | 0.762798 | 4 | 0 | 4 |
For details and further investigation, click here