| Full name: cullin associated and neddylation dissociated 1 | Alias Symbol: TIP120A|DKFZp434M1414|KIAA0829|TIP120 | ||
| Type: protein-coding gene | Cytoband: 12q14.3-q15 | ||
| Entrez ID: 55832 | HGNC ID: HGNC:30688 | Ensembl Gene: ENSG00000111530 | OMIM ID: 607727 |
Screen Evidence:
| |||
Expression of CAND1:
| Dataset | Gene | EntrezID | Probe | Log2FC | Adj.pValue | Expression |
|---|---|---|---|---|---|---|
| GSE17351 | CAND1 | 55832 | 207483_s_at | 0.3003 | 0.5144 | |
| GSE20347 | CAND1 | 55832 | 208838_at | 0.2185 | 0.2392 | |
| GSE23400 | CAND1 | 55832 | 207483_s_at | 0.6577 | 0.0000 | |
| GSE26886 | CAND1 | 55832 | 208838_at | -0.1121 | 0.5570 | |
| GSE29001 | CAND1 | 55832 | 208838_at | 0.6376 | 0.0190 | |
| GSE38129 | CAND1 | 55832 | 208838_at | 0.5347 | 0.0010 | |
| GSE45670 | CAND1 | 55832 | 207483_s_at | 0.2913 | 0.0035 | |
| GSE53622 | CAND1 | 55832 | 32669 | -0.0938 | 0.2175 | |
| GSE53624 | CAND1 | 55832 | 32669 | -0.0351 | 0.7790 | |
| GSE63941 | CAND1 | 55832 | 207483_s_at | 0.2491 | 0.6568 | |
| GSE77861 | CAND1 | 55832 | 207483_s_at | 0.0919 | 0.8945 | |
| GSE97050 | CAND1 | 55832 | A_24_P47681 | -0.3778 | 0.2204 | |
| SRP007169 | CAND1 | 55832 | RNAseq | -0.0580 | 0.8580 | |
| SRP008496 | CAND1 | 55832 | RNAseq | 0.1207 | 0.4208 | |
| SRP064894 | CAND1 | 55832 | RNAseq | 0.2727 | 0.1720 | |
| SRP133303 | CAND1 | 55832 | RNAseq | 0.5501 | 0.0000 | |
| SRP159526 | CAND1 | 55832 | RNAseq | 0.5134 | 0.1327 | |
| SRP193095 | CAND1 | 55832 | RNAseq | 0.1235 | 0.2501 | |
| SRP219564 | CAND1 | 55832 | RNAseq | 0.5598 | 0.3179 | |
| TCGA | CAND1 | 55832 | RNAseq | 0.1289 | 0.0112 |
Upregulated datasets: 0; Downregulated datasets: 0.
Survival by CAND1 expression:
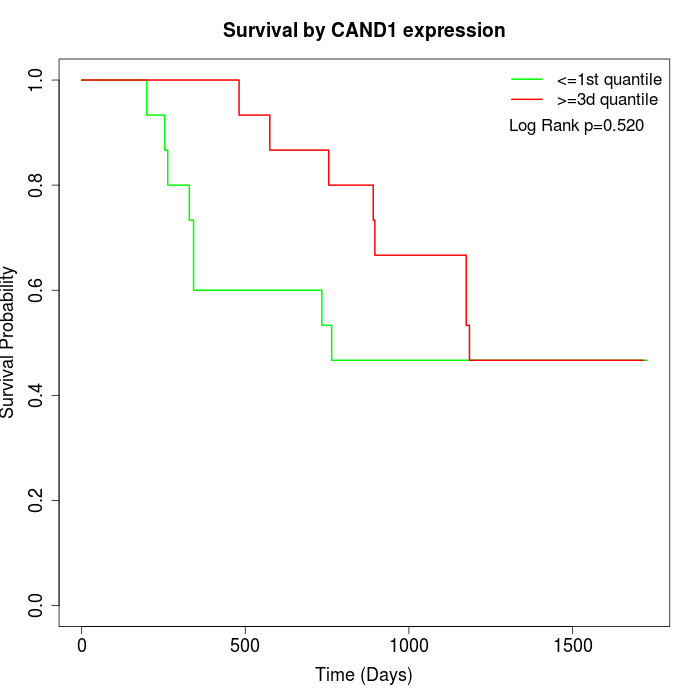 |  | 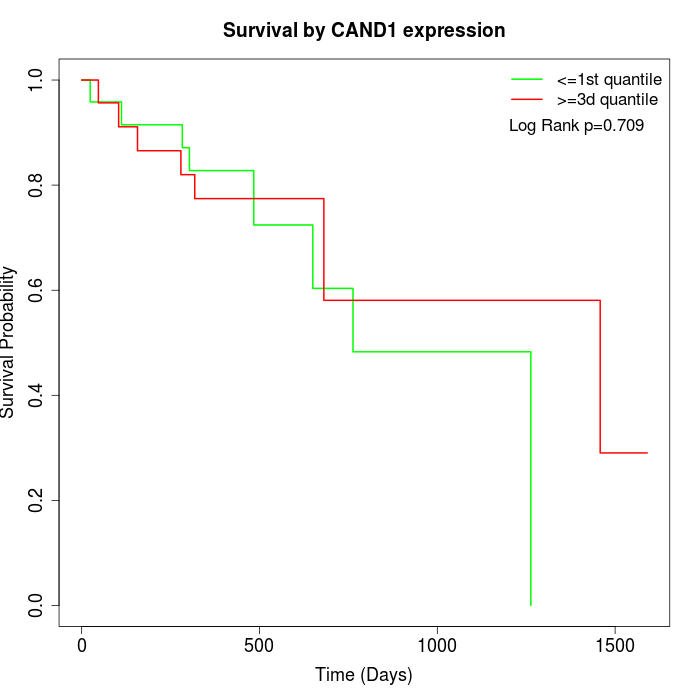 |
| GSE53622 | GSE53624 | TCGA |
Note: Click image to view full size file.
Copy number change of CAND1:
| Dataset | Gene | EntrezID | Gain | Loss | Normal | Detail |
|---|---|---|---|---|---|---|
| GSE15526 | CAND1 | 55832 | 6 | 0 | 24 | |
| GSE20123 | CAND1 | 55832 | 6 | 0 | 24 | |
| GSE43470 | CAND1 | 55832 | 5 | 0 | 38 | |
| GSE46452 | CAND1 | 55832 | 13 | 0 | 46 | |
| GSE47630 | CAND1 | 55832 | 10 | 1 | 29 | |
| GSE54993 | CAND1 | 55832 | 0 | 8 | 62 | |
| GSE54994 | CAND1 | 55832 | 7 | 1 | 45 | |
| GSE60625 | CAND1 | 55832 | 0 | 0 | 11 | |
| GSE74703 | CAND1 | 55832 | 5 | 0 | 31 | |
| GSE74704 | CAND1 | 55832 | 5 | 0 | 15 | |
| TCGA | CAND1 | 55832 | 24 | 9 | 63 |
Total number of gains: 81; Total number of losses: 19; Total Number of normals: 388.
Somatic mutations of CAND1:
Generating mutation plots.
Highly correlated genes for CAND1:
Showing top 20/518 corelated genes with mean PCC>0.5.
| Gene1 | Gene2 | Mean PCC | Num. Datasets | Num. PCC<0 | Num. PCC>0.5 |
|---|---|---|---|---|---|
| CAND1 | PHLPP1 | 0.759045 | 3 | 0 | 3 |
| CAND1 | FAM98B | 0.745108 | 3 | 0 | 3 |
| CAND1 | LATS1 | 0.72352 | 3 | 0 | 3 |
| CAND1 | LCMT2 | 0.720854 | 3 | 0 | 3 |
| CAND1 | ZCCHC2 | 0.701792 | 3 | 0 | 3 |
| CAND1 | ARFGEF2 | 0.697154 | 3 | 0 | 3 |
| CAND1 | SENP1 | 0.688678 | 4 | 0 | 3 |
| CAND1 | SPPL2A | 0.668215 | 3 | 0 | 3 |
| CAND1 | PDAP1 | 0.655471 | 3 | 0 | 3 |
| CAND1 | SMURF2 | 0.655101 | 3 | 0 | 3 |
| CAND1 | MRPL16 | 0.654863 | 4 | 0 | 3 |
| CAND1 | XPO1 | 0.654787 | 8 | 0 | 8 |
| CAND1 | GNS | 0.654481 | 6 | 0 | 5 |
| CAND1 | RAP1B | 0.644633 | 9 | 0 | 8 |
| CAND1 | UHRF1BP1L | 0.643247 | 4 | 0 | 3 |
| CAND1 | SLBP | 0.642505 | 6 | 0 | 5 |
| CAND1 | TRDN | 0.642231 | 4 | 0 | 3 |
| CAND1 | C12orf66 | 0.64161 | 3 | 0 | 3 |
| CAND1 | ORC5 | 0.637109 | 6 | 0 | 6 |
| CAND1 | BET1 | 0.636623 | 8 | 0 | 7 |
For details and further investigation, click here