| Full name: SUMO specific peptidase 1 | Alias Symbol: | ||
| Type: protein-coding gene | Cytoband: 12q13.11 | ||
| Entrez ID: 29843 | HGNC ID: HGNC:17927 | Ensembl Gene: ENSG00000079387 | OMIM ID: 612157 |
Screen Evidence:
| |||
Expression of SENP1:
| Dataset | Gene | EntrezID | Probe | Log2FC | Adj.pValue | Expression |
|---|---|---|---|---|---|---|
| GSE17351 | SENP1 | 29843 | 226619_at | 0.4026 | 0.2893 | |
| GSE26886 | SENP1 | 29843 | 226619_at | 0.4284 | 0.0846 | |
| GSE45670 | SENP1 | 29843 | 226619_at | 0.0844 | 0.5111 | |
| GSE53622 | SENP1 | 29843 | 20474 | -0.0690 | 0.5263 | |
| GSE53624 | SENP1 | 29843 | 20474 | -0.2314 | 0.0774 | |
| GSE63941 | SENP1 | 29843 | 226619_at | 0.2108 | 0.4968 | |
| GSE77861 | SENP1 | 29843 | 226619_at | 0.2778 | 0.0271 | |
| GSE97050 | SENP1 | 29843 | A_33_P3304528 | -0.1714 | 0.5435 | |
| SRP007169 | SENP1 | 29843 | RNAseq | 0.3961 | 0.3081 | |
| SRP008496 | SENP1 | 29843 | RNAseq | 0.5298 | 0.0105 | |
| SRP064894 | SENP1 | 29843 | RNAseq | 0.3198 | 0.0544 | |
| SRP133303 | SENP1 | 29843 | RNAseq | 0.5729 | 0.0030 | |
| SRP159526 | SENP1 | 29843 | RNAseq | 0.5669 | 0.0115 | |
| SRP193095 | SENP1 | 29843 | RNAseq | 0.5200 | 0.0002 | |
| SRP219564 | SENP1 | 29843 | RNAseq | 0.3119 | 0.2573 | |
| TCGA | SENP1 | 29843 | RNAseq | 0.1890 | 0.0004 |
Upregulated datasets: 0; Downregulated datasets: 0.
Survival by SENP1 expression:
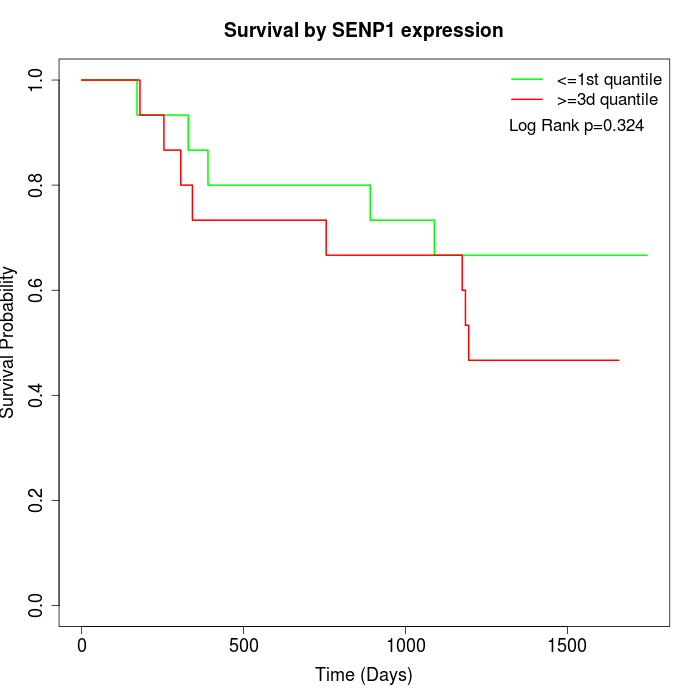 | 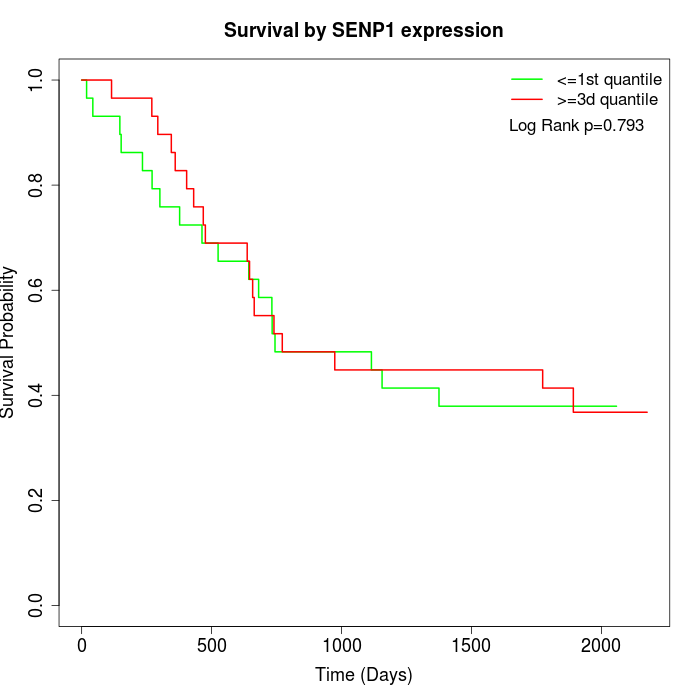 | 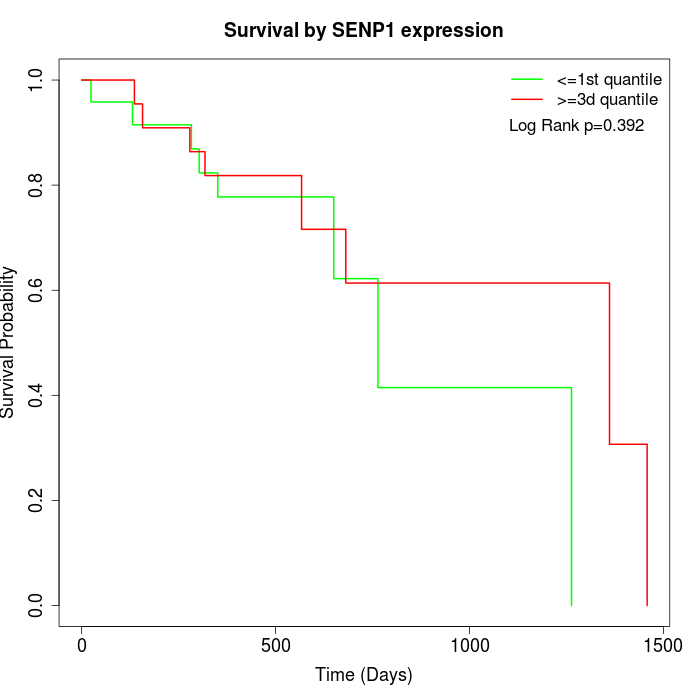 |
| GSE53622 | GSE53624 | TCGA |
Note: Click image to view full size file.
Copy number change of SENP1:
| Dataset | Gene | EntrezID | Gain | Loss | Normal | Detail |
|---|---|---|---|---|---|---|
| GSE15526 | SENP1 | 29843 | 7 | 1 | 22 | |
| GSE20123 | SENP1 | 29843 | 7 | 1 | 22 | |
| GSE43470 | SENP1 | 29843 | 3 | 1 | 39 | |
| GSE46452 | SENP1 | 29843 | 8 | 1 | 50 | |
| GSE47630 | SENP1 | 29843 | 11 | 2 | 27 | |
| GSE54993 | SENP1 | 29843 | 0 | 5 | 65 | |
| GSE54994 | SENP1 | 29843 | 6 | 1 | 46 | |
| GSE60625 | SENP1 | 29843 | 0 | 0 | 11 | |
| GSE74703 | SENP1 | 29843 | 3 | 1 | 32 | |
| GSE74704 | SENP1 | 29843 | 4 | 1 | 15 | |
| TCGA | SENP1 | 29843 | 16 | 12 | 68 |
Total number of gains: 65; Total number of losses: 26; Total Number of normals: 397.
Somatic mutations of SENP1:
Generating mutation plots.
Highly correlated genes for SENP1:
Showing top 20/447 corelated genes with mean PCC>0.5.
| Gene1 | Gene2 | Mean PCC | Num. Datasets | Num. PCC<0 | Num. PCC>0.5 |
|---|---|---|---|---|---|
| SENP1 | LRRC58 | 0.814552 | 3 | 0 | 3 |
| SENP1 | MED26 | 0.81077 | 3 | 0 | 3 |
| SENP1 | ZNF3 | 0.798721 | 3 | 0 | 3 |
| SENP1 | KIR3DL2 | 0.769406 | 3 | 0 | 3 |
| SENP1 | AGPS | 0.768684 | 3 | 0 | 3 |
| SENP1 | RIOK1 | 0.768044 | 3 | 0 | 3 |
| SENP1 | RNF138 | 0.765826 | 3 | 0 | 3 |
| SENP1 | KDM5A | 0.765787 | 3 | 0 | 3 |
| SENP1 | COCH | 0.76507 | 3 | 0 | 3 |
| SENP1 | RNPS1 | 0.76387 | 3 | 0 | 3 |
| SENP1 | CRKL | 0.760429 | 3 | 0 | 3 |
| SENP1 | LRRC34 | 0.758824 | 3 | 0 | 3 |
| SENP1 | TOPBP1 | 0.755316 | 4 | 0 | 4 |
| SENP1 | SERPINB10 | 0.753216 | 3 | 0 | 3 |
| SENP1 | TMEM150A | 0.753194 | 3 | 0 | 3 |
| SENP1 | POGLUT1 | 0.753181 | 3 | 0 | 3 |
| SENP1 | EMG1 | 0.752713 | 3 | 0 | 3 |
| SENP1 | ZBTB41 | 0.75258 | 3 | 0 | 3 |
| SENP1 | SKA1 | 0.752172 | 3 | 0 | 3 |
| SENP1 | M6PR | 0.746246 | 3 | 0 | 3 |
For details and further investigation, click here