| Full name: prostaglandin D2 receptor 2 | Alias Symbol: CRTH2|CD294|DP2 | ||
| Type: protein-coding gene | Cytoband: 11q12.2 | ||
| Entrez ID: 11251 | HGNC ID: HGNC:4502 | Ensembl Gene: ENSG00000183134 | OMIM ID: 604837 |
| Related drugs: ADC3680, AM-211, AM-461, ARRY-502, AZD1981, CHEMBL1397260, CHEMBL1643768, CHEMBL264421, CHEMBL357834, CHEMBL370606... [more] | |||
Expression of PTGDR2:
| Dataset | Gene | EntrezID | Probe | Log2FC | Adj.pValue | Expression |
|---|---|---|---|---|---|---|
| GSE17351 | PTGDR2 | 11251 | 206361_at | -0.2084 | 0.5143 | |
| GSE20347 | PTGDR2 | 11251 | 206361_at | -0.1192 | 0.1354 | |
| GSE23400 | PTGDR2 | 11251 | 206361_at | -0.1857 | 0.0000 | |
| GSE26886 | PTGDR2 | 11251 | 206361_at | -0.1585 | 0.2594 | |
| GSE29001 | PTGDR2 | 11251 | 206361_at | -0.2068 | 0.2731 | |
| GSE38129 | PTGDR2 | 11251 | 206361_at | -0.3687 | 0.0001 | |
| GSE45670 | PTGDR2 | 11251 | 206361_at | -0.1518 | 0.1020 | |
| GSE53622 | PTGDR2 | 11251 | 9905 | -0.7211 | 0.0000 | |
| GSE53624 | PTGDR2 | 11251 | 9905 | -0.6554 | 0.0000 | |
| GSE63941 | PTGDR2 | 11251 | 206361_at | 0.1354 | 0.4529 | |
| GSE77861 | PTGDR2 | 11251 | 206361_at | -0.1197 | 0.2965 | |
| GSE97050 | PTGDR2 | 11251 | A_24_P115932 | -0.0191 | 0.9418 | |
| SRP133303 | PTGDR2 | 11251 | RNAseq | -1.3210 | 0.0007 | |
| SRP159526 | PTGDR2 | 11251 | RNAseq | -0.9172 | 0.1224 | |
| SRP219564 | PTGDR2 | 11251 | RNAseq | -1.9298 | 0.0037 |
Upregulated datasets: 0; Downregulated datasets: 2.
Survival by PTGDR2 expression:
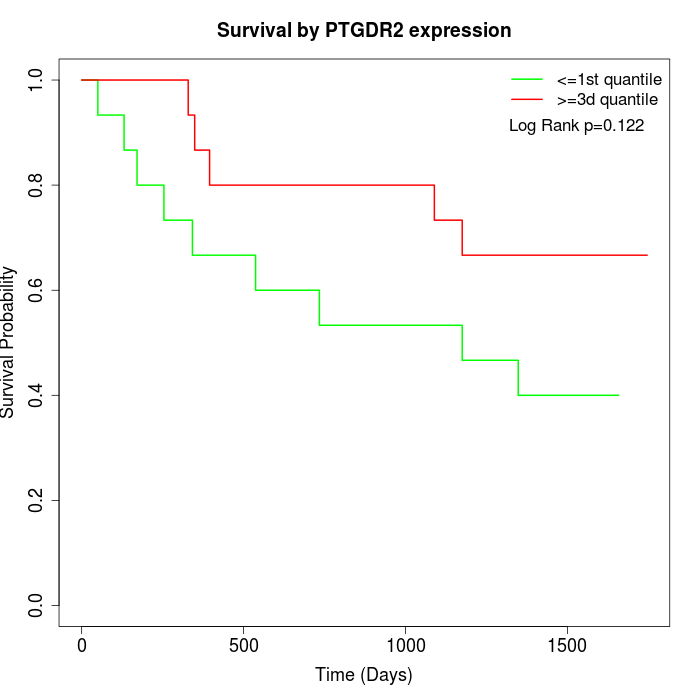 | 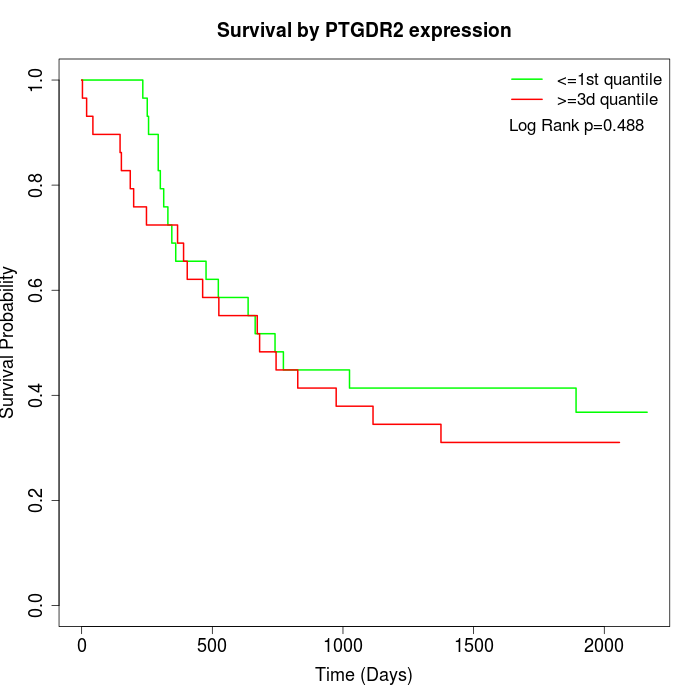 |
| GSE53622 | GSE53624 |
Note: Click image to view full size file.
Copy number change of PTGDR2:
| Dataset | Gene | EntrezID | Gain | Loss | Normal | Detail |
|---|---|---|---|---|---|---|
| GSE15526 | PTGDR2 | 11251 | 2 | 5 | 23 | |
| GSE20123 | PTGDR2 | 11251 | 2 | 5 | 23 | |
| GSE43470 | PTGDR2 | 11251 | 2 | 6 | 35 | |
| GSE46452 | PTGDR2 | 11251 | 8 | 4 | 47 | |
| GSE47630 | PTGDR2 | 11251 | 3 | 8 | 29 | |
| GSE54993 | PTGDR2 | 11251 | 3 | 0 | 67 | |
| GSE54994 | PTGDR2 | 11251 | 5 | 5 | 43 | |
| GSE60625 | PTGDR2 | 11251 | 0 | 3 | 8 | |
| GSE74703 | PTGDR2 | 11251 | 2 | 3 | 31 | |
| GSE74704 | PTGDR2 | 11251 | 2 | 3 | 15 | |
| TCGA | PTGDR2 | 11251 | 15 | 10 | 71 |
Total number of gains: 44; Total number of losses: 52; Total Number of normals: 392.
Somatic mutations of PTGDR2:
Generating mutation plots.
Highly correlated genes for PTGDR2:
Showing top 20/282 corelated genes with mean PCC>0.5.
| Gene1 | Gene2 | Mean PCC | Num. Datasets | Num. PCC<0 | Num. PCC>0.5 |
|---|---|---|---|---|---|
| PTGDR2 | CLCN1 | 0.793136 | 3 | 0 | 3 |
| PTGDR2 | LMAN1L | 0.788689 | 4 | 0 | 4 |
| PTGDR2 | AMN | 0.752742 | 3 | 0 | 3 |
| PTGDR2 | GPD1 | 0.745639 | 3 | 0 | 3 |
| PTGDR2 | MYO18B | 0.744223 | 3 | 0 | 3 |
| PTGDR2 | KRTAP9-9 | 0.729372 | 3 | 0 | 3 |
| PTGDR2 | CDH4 | 0.725086 | 3 | 0 | 3 |
| PTGDR2 | MYOZ3 | 0.710778 | 3 | 0 | 3 |
| PTGDR2 | AIRE | 0.710062 | 4 | 0 | 3 |
| PTGDR2 | SCNN1D | 0.708937 | 3 | 0 | 3 |
| PTGDR2 | MAPK8IP2 | 0.705748 | 4 | 0 | 3 |
| PTGDR2 | ABCA2 | 0.702809 | 4 | 0 | 3 |
| PTGDR2 | C11orf86 | 0.701306 | 3 | 0 | 3 |
| PTGDR2 | CELF4 | 0.698883 | 3 | 0 | 3 |
| PTGDR2 | LIM2 | 0.693321 | 3 | 0 | 3 |
| PTGDR2 | F2 | 0.684768 | 4 | 0 | 3 |
| PTGDR2 | ADM2 | 0.682667 | 5 | 0 | 4 |
| PTGDR2 | CEND1 | 0.68216 | 4 | 0 | 3 |
| PTGDR2 | GFRA2 | 0.681741 | 4 | 0 | 3 |
| PTGDR2 | CHDH | 0.681485 | 3 | 0 | 3 |
For details and further investigation, click here