| Full name: centrosomal protein 19 | Alias Symbol: MGC14126 | ||
| Type: protein-coding gene | Cytoband: 3q29 | ||
| Entrez ID: 84984 | HGNC ID: HGNC:28209 | Ensembl Gene: ENSG00000174007 | OMIM ID: 615586 |
Expression of CEP19:
| Dataset | Gene | EntrezID | Probe | Log2FC | Adj.pValue | Expression |
|---|---|---|---|---|---|---|
| GSE17351 | CEP19 | 84984 | 230860_at | 1.6480 | 0.1535 | |
| GSE26886 | CEP19 | 84984 | 230860_at | 0.6748 | 0.1232 | |
| GSE45670 | CEP19 | 84984 | 230860_at | 1.6561 | 0.0000 | |
| GSE53622 | CEP19 | 84984 | 159867 | 1.1101 | 0.0000 | |
| GSE53624 | CEP19 | 84984 | 159867 | 1.1914 | 0.0000 | |
| GSE63941 | CEP19 | 84984 | 1553158_at | 0.7652 | 0.2667 | |
| GSE77861 | CEP19 | 84984 | 230860_at | 0.6965 | 0.0291 | |
| GSE97050 | CEP19 | 84984 | A_32_P212058 | 0.4207 | 0.1894 | |
| SRP007169 | CEP19 | 84984 | RNAseq | 2.8505 | 0.0001 | |
| SRP008496 | CEP19 | 84984 | RNAseq | 2.5817 | 0.0000 | |
| SRP064894 | CEP19 | 84984 | RNAseq | 1.4094 | 0.0000 | |
| SRP133303 | CEP19 | 84984 | RNAseq | 1.1221 | 0.0000 | |
| SRP159526 | CEP19 | 84984 | RNAseq | 2.2085 | 0.0000 | |
| SRP193095 | CEP19 | 84984 | RNAseq | 1.5418 | 0.0000 | |
| SRP219564 | CEP19 | 84984 | RNAseq | 0.4385 | 0.3345 |
Upregulated datasets: 9; Downregulated datasets: 0.
Survival by CEP19 expression:
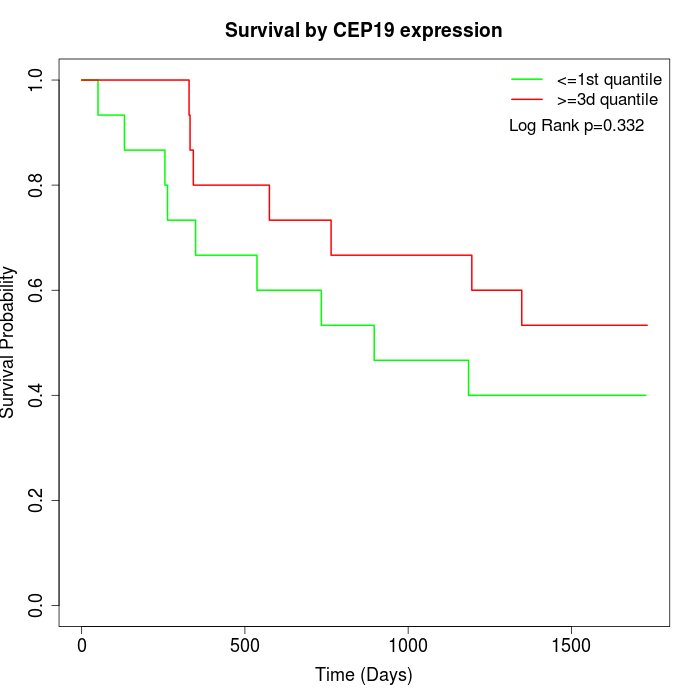 | 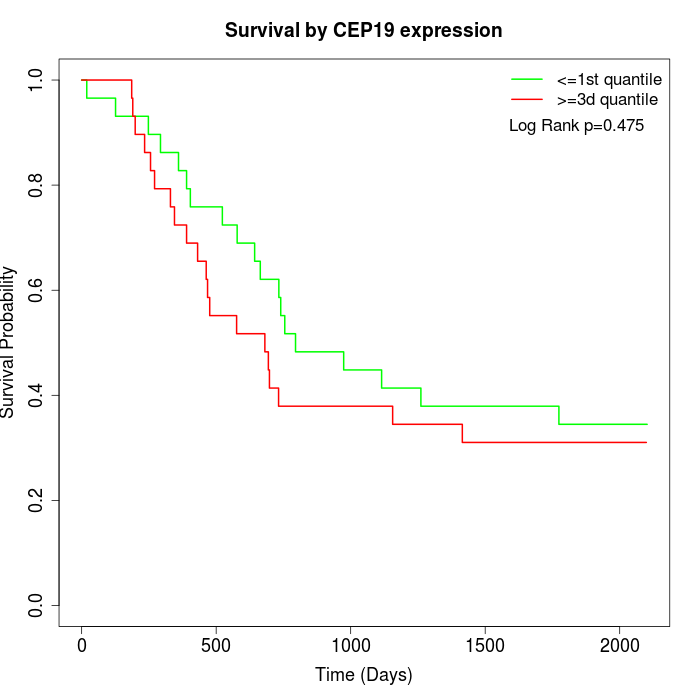 |
| GSE53622 | GSE53624 |
Note: Click image to view full size file.
Copy number change of CEP19:
| Dataset | Gene | EntrezID | Gain | Loss | Normal | Detail |
|---|---|---|---|---|---|---|
| GSE15526 | CEP19 | 84984 | 22 | 0 | 8 | |
| GSE20123 | CEP19 | 84984 | 22 | 0 | 8 | |
| GSE43470 | CEP19 | 84984 | 21 | 0 | 22 | |
| GSE46452 | CEP19 | 84984 | 19 | 1 | 39 | |
| GSE47630 | CEP19 | 84984 | 27 | 2 | 11 | |
| GSE54993 | CEP19 | 84984 | 1 | 22 | 47 | |
| GSE54994 | CEP19 | 84984 | 41 | 0 | 12 | |
| GSE60625 | CEP19 | 84984 | 0 | 6 | 5 | |
| GSE74703 | CEP19 | 84984 | 19 | 0 | 17 | |
| GSE74704 | CEP19 | 84984 | 14 | 0 | 6 | |
| TCGA | CEP19 | 84984 | 76 | 1 | 19 |
Total number of gains: 262; Total number of losses: 32; Total Number of normals: 194.
Somatic mutations of CEP19:
Generating mutation plots.
Highly correlated genes for CEP19:
Showing top 20/491 corelated genes with mean PCC>0.5.
| Gene1 | Gene2 | Mean PCC | Num. Datasets | Num. PCC<0 | Num. PCC>0.5 |
|---|---|---|---|---|---|
| CEP19 | FEN1 | 0.762169 | 4 | 0 | 4 |
| CEP19 | SNAI2 | 0.751278 | 4 | 0 | 4 |
| CEP19 | CDC6 | 0.743318 | 4 | 0 | 4 |
| CEP19 | KNSTRN | 0.723349 | 5 | 0 | 5 |
| CEP19 | FXYD3 | 0.717736 | 3 | 0 | 3 |
| CEP19 | SLC4A11 | 0.710726 | 3 | 0 | 3 |
| CEP19 | CBX3 | 0.709541 | 7 | 0 | 6 |
| CEP19 | DEPDC1B | 0.70919 | 6 | 0 | 6 |
| CEP19 | SPDL1 | 0.695016 | 4 | 0 | 4 |
| CEP19 | CHTF8 | 0.694605 | 3 | 0 | 3 |
| CEP19 | LRRC8D | 0.685256 | 6 | 0 | 5 |
| CEP19 | EME1 | 0.683136 | 3 | 0 | 3 |
| CEP19 | RAD51 | 0.681703 | 6 | 0 | 6 |
| CEP19 | ORC6 | 0.681485 | 6 | 0 | 6 |
| CEP19 | EML6 | 0.681233 | 4 | 0 | 3 |
| CEP19 | HMGA2 | 0.681195 | 3 | 0 | 3 |
| CEP19 | WDR53 | 0.679398 | 8 | 0 | 8 |
| CEP19 | ZIC5 | 0.679269 | 3 | 0 | 3 |
| CEP19 | KIF4A | 0.677444 | 7 | 0 | 6 |
| CEP19 | TRIP13 | 0.677056 | 5 | 0 | 5 |
For details and further investigation, click here