| Full name: thyroid hormone receptor interactor 13 | Alias Symbol: 16E1BP | ||
| Type: protein-coding gene | Cytoband: 5p15.33 | ||
| Entrez ID: 9319 | HGNC ID: HGNC:12307 | Ensembl Gene: ENSG00000071539 | OMIM ID: 604507 |
| Drug and gene relationship at DGIdb | |||
Screen Evidence:
| |||
Expression of TRIP13:
| Dataset | Gene | EntrezID | Probe | Log2FC | Adj.pValue | Expression |
|---|---|---|---|---|---|---|
| GSE17351 | TRIP13 | 9319 | 204033_at | 1.6787 | 0.0072 | |
| GSE20347 | TRIP13 | 9319 | 204033_at | 1.9698 | 0.0000 | |
| GSE23400 | TRIP13 | 9319 | 204033_at | 1.3015 | 0.0000 | |
| GSE26886 | TRIP13 | 9319 | 204033_at | 1.5348 | 0.0002 | |
| GSE29001 | TRIP13 | 9319 | 204033_at | 1.6262 | 0.0001 | |
| GSE38129 | TRIP13 | 9319 | 204033_at | 2.3382 | 0.0000 | |
| GSE45670 | TRIP13 | 9319 | 204033_at | 1.8092 | 0.0000 | |
| GSE53622 | TRIP13 | 9319 | 62283 | 2.2454 | 0.0000 | |
| GSE53624 | TRIP13 | 9319 | 151375 | 2.0603 | 0.0000 | |
| GSE63941 | TRIP13 | 9319 | 204033_at | 2.8286 | 0.0003 | |
| GSE77861 | TRIP13 | 9319 | 204033_at | 1.4754 | 0.0096 | |
| GSE97050 | TRIP13 | 9319 | A_33_P3407256 | 2.4221 | 0.1297 | |
| SRP007169 | TRIP13 | 9319 | RNAseq | 2.1787 | 0.0000 | |
| SRP008496 | TRIP13 | 9319 | RNAseq | 2.0427 | 0.0000 | |
| SRP064894 | TRIP13 | 9319 | RNAseq | 1.4025 | 0.0000 | |
| SRP133303 | TRIP13 | 9319 | RNAseq | 1.9524 | 0.0000 | |
| SRP159526 | TRIP13 | 9319 | RNAseq | 2.1668 | 0.0000 | |
| SRP193095 | TRIP13 | 9319 | RNAseq | 1.5067 | 0.0000 | |
| SRP219564 | TRIP13 | 9319 | RNAseq | 2.2867 | 0.0043 | |
| TCGA | TRIP13 | 9319 | RNAseq | 1.2085 | 0.0000 |
Upregulated datasets: 19; Downregulated datasets: 0.
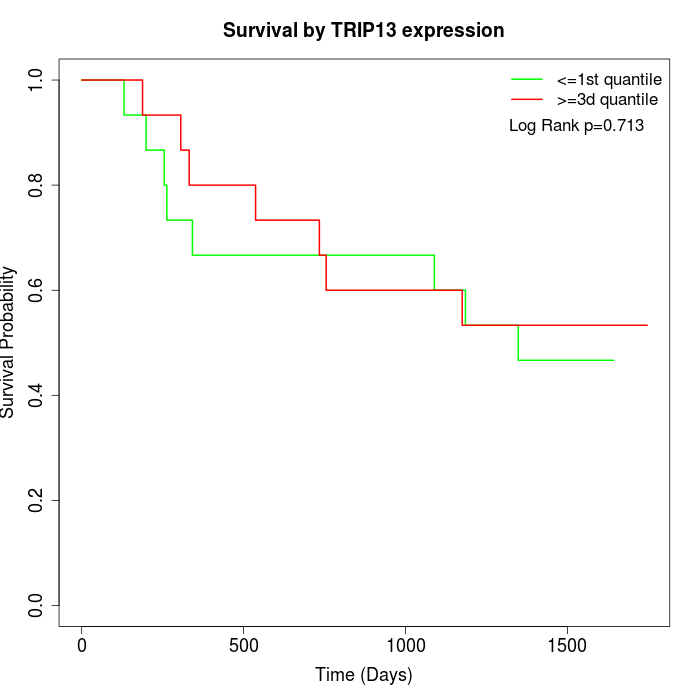
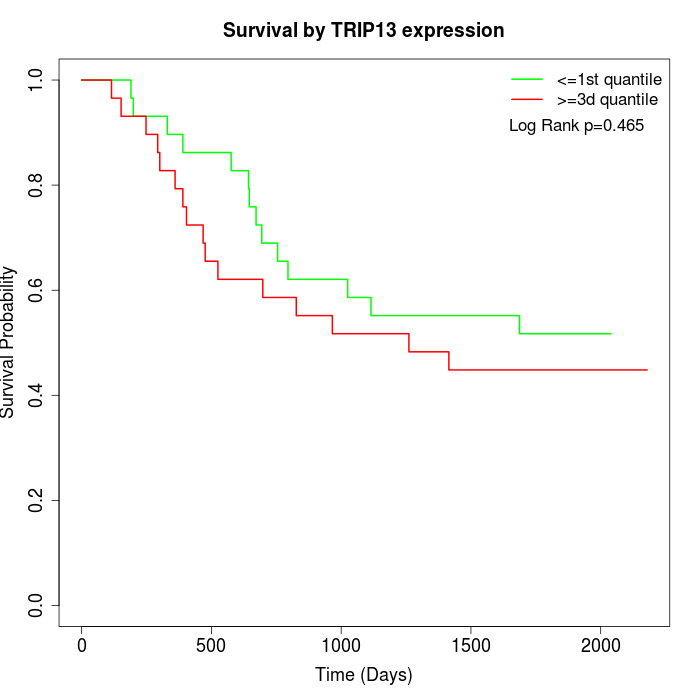
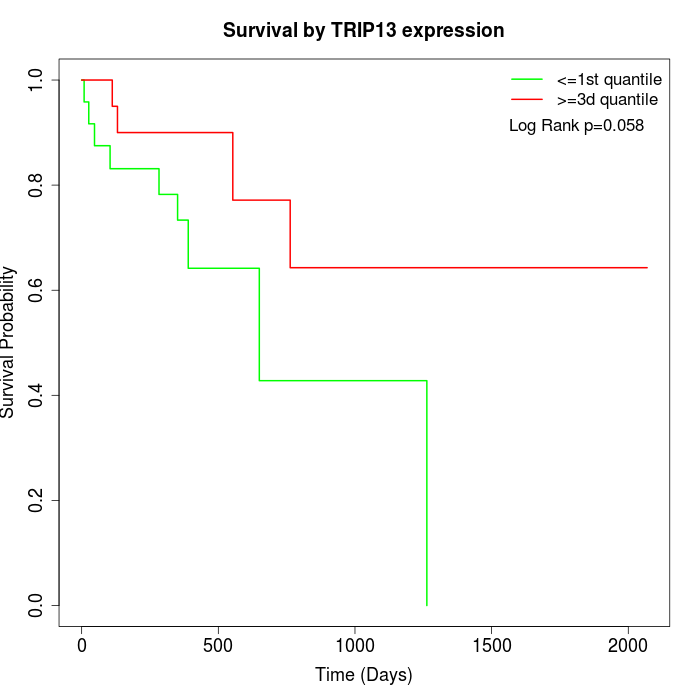
Survival by TRIP13 expression:
Note: Click image to view full size file.
Copy number change of TRIP13:
| Dataset | Gene | EntrezID | Gain | Loss | Normal | Detail |
|---|---|---|---|---|---|---|
| GSE15526 | TRIP13 | 9319 | 13 | 1 | 16 | |
| GSE20123 | TRIP13 | 9319 | 13 | 1 | 16 | |
| GSE43470 | TRIP13 | 9319 | 17 | 1 | 25 | |
| GSE46452 | TRIP13 | 9319 | 6 | 22 | 31 | |
| GSE47630 | TRIP13 | 9319 | 8 | 11 | 21 | |
| GSE54993 | TRIP13 | 9319 | 5 | 6 | 59 | |
| GSE54994 | TRIP13 | 9319 | 29 | 1 | 23 | |
| GSE60625 | TRIP13 | 9319 | 0 | 0 | 11 | |
| GSE74703 | TRIP13 | 9319 | 14 | 0 | 22 | |
| GSE74704 | TRIP13 | 9319 | 11 | 0 | 9 | |
| TCGA | TRIP13 | 9319 | 60 | 4 | 32 |
Total number of gains: 176; Total number of losses: 47; Total Number of normals: 265.
Somatic mutations of TRIP13:
Generating mutation plots.
Highly correlated genes for TRIP13:
Showing top 20/1975 corelated genes with mean PCC>0.5.
| Gene1 | Gene2 | Mean PCC | Num. Datasets | Num. PCC<0 | Num. PCC>0.5 |
|---|---|---|---|---|---|
| TRIP13 | CENPF | 0.854205 | 12 | 0 | 12 |
| TRIP13 | NCAPH | 0.847199 | 9 | 0 | 9 |
| TRIP13 | UBE2C | 0.836675 | 13 | 0 | 12 |
| TRIP13 | KIF14 | 0.835494 | 13 | 0 | 13 |
| TRIP13 | AURKB | 0.835119 | 13 | 0 | 12 |
| TRIP13 | ECT2 | 0.834287 | 12 | 0 | 12 |
| TRIP13 | NEK2 | 0.834067 | 13 | 0 | 12 |
| TRIP13 | KIF4A | 0.833445 | 12 | 0 | 11 |
| TRIP13 | KNSTRN | 0.832307 | 7 | 0 | 7 |
| TRIP13 | RAD51 | 0.829891 | 11 | 0 | 11 |
| TRIP13 | TPX2 | 0.829516 | 13 | 0 | 12 |
| TRIP13 | CDC6 | 0.829184 | 9 | 0 | 9 |
| TRIP13 | CDKN3 | 0.828091 | 12 | 0 | 12 |
| TRIP13 | CDK1 | 0.827985 | 12 | 0 | 12 |
| TRIP13 | MTFR2 | 0.827383 | 7 | 0 | 7 |
| TRIP13 | MYBL2 | 0.826345 | 12 | 0 | 12 |
| TRIP13 | CDC45 | 0.824824 | 12 | 0 | 12 |
| TRIP13 | MCM4 | 0.823907 | 13 | 0 | 13 |
| TRIP13 | KIF2C | 0.823241 | 13 | 0 | 12 |
| TRIP13 | GINS1 | 0.822657 | 12 | 0 | 12 |
For details and further investigation, click here


